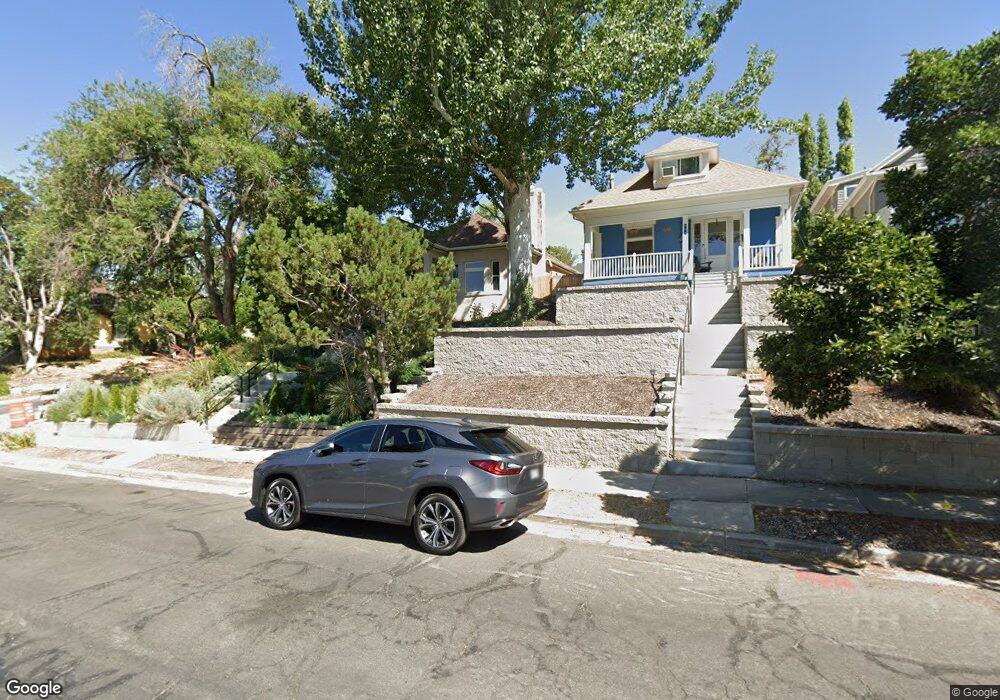
601 E 9th Ave Salt Lake City, UT 84103
The Avenues NeighborhoodEstimated Value: $753,000 - $800,000
3
Beds
2
Baths
2,217
Sq Ft
$352/Sq Ft
Est. Value
About This Home
This home is located at 601 E 9th Ave, Salt Lake City, UT 84103 and is currently estimated at $779,629, approximately $351 per square foot. 601 E 9th Ave is a home located in Salt Lake County with nearby schools including Ensign School, West High, and Open Classroom.
Ownership History
Date
Name
Owned For
Owner Type
Purchase Details
Closed on
May 15, 2023
Sold by
Huve Stephen
Bought by
Stuart Joseph Patrick and Benson Eric
Current Estimated Value
Home Financials for this Owner
Home Financials are based on the most recent Mortgage that was taken out on this home.
Original Mortgage
$589,600
Outstanding Balance
$572,995
Interest Rate
6.32%
Mortgage Type
New Conventional
Estimated Equity
$206,634
Purchase Details
Closed on
Jun 2, 2016
Sold by
James Lawrence Jensen V and James L Jensen V
Bought by
Huve Stephen and Huve Allyson
Purchase Details
Closed on
Apr 27, 2015
Sold by
Bourdeaux Nichol
Bought by
Jensen V James Lawrence and James L Jensen V
Purchase Details
Closed on
Jan 24, 2013
Sold by
Bourdeaux Nichol and Jensen James Lawrence
Bought by
Jensen V James Lawrence and Bourdeaux Nichol
Home Financials for this Owner
Home Financials are based on the most recent Mortgage that was taken out on this home.
Original Mortgage
$344,000
Interest Rate
3.28%
Mortgage Type
New Conventional
Purchase Details
Closed on
Nov 25, 2009
Sold by
Self William N and Self Amanda K
Bought by
Bourdeaux Nichol and Jensen James Lawrence
Home Financials for this Owner
Home Financials are based on the most recent Mortgage that was taken out on this home.
Original Mortgage
$353,479
Interest Rate
4.88%
Mortgage Type
FHA
Purchase Details
Closed on
Dec 20, 2002
Sold by
Self William N and Self Amanda K
Bought by
Self William N and Self Amanda K
Home Financials for this Owner
Home Financials are based on the most recent Mortgage that was taken out on this home.
Original Mortgage
$179,500
Interest Rate
5.86%
Purchase Details
Closed on
Jul 7, 1999
Sold by
Mcdowell Carole
Bought by
Self William N and Self Amanda K
Purchase Details
Closed on
Jun 18, 1998
Sold by
Rollo Laura and Burns Laura Anne
Bought by
Mcdowell Carole
Purchase Details
Closed on
Dec 29, 1995
Sold by
Larralde Signa
Bought by
Burns Laura Anne
Home Financials for this Owner
Home Financials are based on the most recent Mortgage that was taken out on this home.
Original Mortgage
$147,250
Interest Rate
7.36%
Create a Home Valuation Report for This Property
The Home Valuation Report is an in-depth analysis detailing your home's value as well as a comparison with similar homes in the area
Home Values in the Area
Average Home Value in this Area
Purchase History
| Date | Buyer | Sale Price | Title Company |
|---|---|---|---|
| Stuart Joseph Patrick | -- | None Listed On Document | |
| Huve Stephen | -- | Paramount Title | |
| Jensen V James Lawrence | -- | Monument Title Ins Co | |
| Jensen V James Lawrence | -- | Benchmark Title Ins Agcy | |
| Bourdeaux Nichol | -- | Title West | |
| Self William N | -- | Paramount Title | |
| Self William N | -- | -- | |
| Mcdowell Carole | -- | -- | |
| Burns Laura Anne | -- | -- |
Source: Public Records
Mortgage History
| Date | Status | Borrower | Loan Amount |
|---|---|---|---|
| Open | Stuart Joseph Patrick | $589,600 | |
| Previous Owner | Jensen V James Lawrence | $344,000 | |
| Previous Owner | Bourdeaux Nichol | $353,479 | |
| Previous Owner | Self William N | $179,500 | |
| Previous Owner | Burns Laura Anne | $147,250 |
Source: Public Records
Tax History Compared to Growth
Tax History
| Year | Tax Paid | Tax Assessment Tax Assessment Total Assessment is a certain percentage of the fair market value that is determined by local assessors to be the total taxable value of land and additions on the property. | Land | Improvement |
|---|---|---|---|---|
| 2025 | $3,739 | $766,400 | $238,400 | $528,000 |
| 2024 | $3,739 | $713,400 | $227,600 | $485,800 |
| 2023 | $3,425 | $629,900 | $218,800 | $411,100 |
| 2022 | $3,795 | $654,800 | $163,000 | $491,800 |
| 2021 | $3,391 | $529,800 | $132,500 | $397,300 |
| 2020 | $3,332 | $495,500 | $123,800 | $371,700 |
| 2019 | $2,991 | $418,400 | $115,600 | $302,800 |
| 2018 | $0 | $403,600 | $115,600 | $288,000 |
| 2017 | $3,025 | $386,100 | $115,600 | $270,500 |
| 2016 | $2,826 | $342,500 | $110,700 | $231,800 |
| 2015 | $3,024 | $347,400 | $107,200 | $240,200 |
| 2014 | -- | $313,300 | $101,500 | $211,800 |
Source: Public Records
Map
Nearby Homes