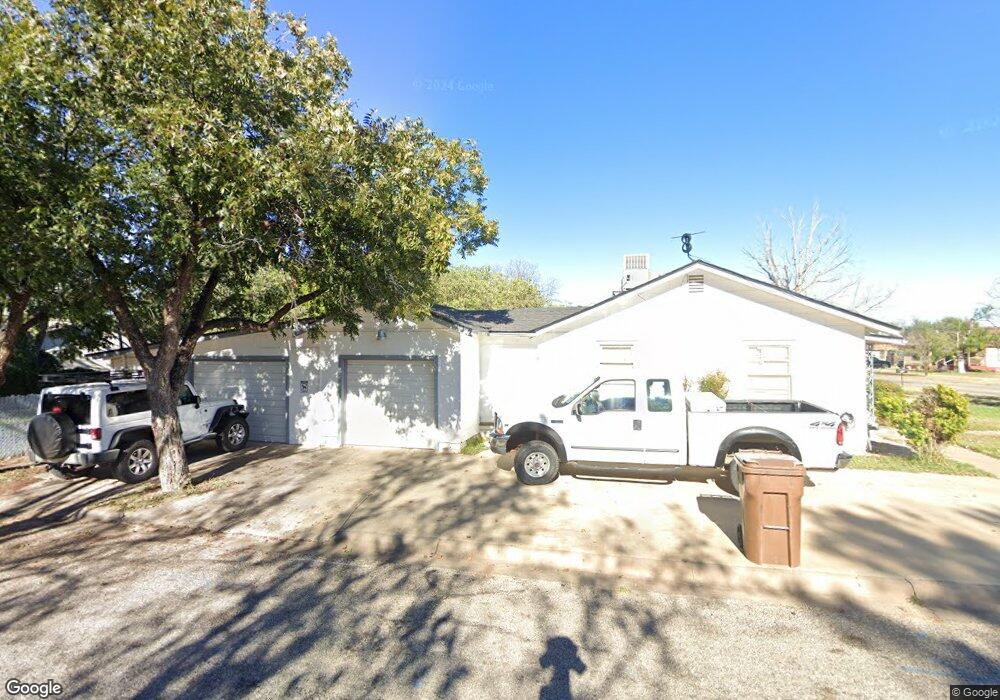
601 George St Big Spring, TX 79720
Estimated Value: $133,000 - $153,000
--
Bed
--
Bath
2,505
Sq Ft
$58/Sq Ft
Est. Value
About This Home
This home is located at 601 George St, Big Spring, TX 79720 and is currently estimated at $144,475, approximately $57 per square foot. 601 George St is a home located in Howard County with nearby schools including Big Spring High School.
Ownership History
Date
Name
Owned For
Owner Type
Purchase Details
Closed on
Jul 31, 2023
Sold by
Casey Debra D
Bought by
Wallis Vickie Diane and Farmer Jeri Denise
Current Estimated Value
Purchase Details
Closed on
Feb 28, 2020
Sold by
Langford Brittany D and Langford Jeremy
Bought by
Hoffman Charles Andrew
Home Financials for this Owner
Home Financials are based on the most recent Mortgage that was taken out on this home.
Original Mortgage
$120,000
Interest Rate
3.6%
Mortgage Type
VA
Purchase Details
Closed on
Dec 18, 2017
Sold by
Wallis Vickle and Farmer Jeri
Bought by
Langford Brittany D and Langford Jeremy
Home Financials for this Owner
Home Financials are based on the most recent Mortgage that was taken out on this home.
Original Mortgage
$77,000
Interest Rate
3.9%
Mortgage Type
New Conventional
Purchase Details
Closed on
Sep 1, 2016
Sold by
Casey Debra
Bought by
Wallis Vicki and Farmer Jeri
Create a Home Valuation Report for This Property
The Home Valuation Report is an in-depth analysis detailing your home's value as well as a comparison with similar homes in the area
Home Values in the Area
Average Home Value in this Area
Purchase History
| Date | Buyer | Sale Price | Title Company |
|---|---|---|---|
| Wallis Vickie Diane | -- | None Listed On Document | |
| Hoffman Charles Andrew | -- | Surety Title Company | |
| Langford Brittany D | -- | Surety Title Company | |
| Wallis Vicki | -- | None Available |
Source: Public Records
Mortgage History
| Date | Status | Borrower | Loan Amount |
|---|---|---|---|
| Previous Owner | Hoffman Charles Andrew | $120,000 | |
| Previous Owner | Langford Brittany D | $77,000 |
Source: Public Records
Tax History Compared to Growth
Tax History
| Year | Tax Paid | Tax Assessment Tax Assessment Total Assessment is a certain percentage of the fair market value that is determined by local assessors to be the total taxable value of land and additions on the property. | Land | Improvement |
|---|---|---|---|---|
| 2024 | $1,909 | $107,281 | $5,080 | $102,201 |
| 2023 | $1,998 | $113,353 | $5,850 | $107,503 |
| 2022 | $1,715 | $83,993 | $4,875 | $79,118 |
| 2021 | $2,597 | $110,506 | $4,875 | $105,631 |
| 2020 | $1,544 | $64,943 | $4,875 | $60,068 |
| 2019 | $1,580 | $62,478 | $4,875 | $57,603 |
| 2018 | $1,904 | $63,545 | $4,875 | $58,670 |
| 2017 | $1,576 | $53,542 | $4,472 | $49,070 |
| 2016 | $1,607 | $54,608 | $4,472 | $50,136 |
| 2015 | -- | $55,676 | $4,472 | $51,204 |
| 2014 | -- | $48,149 | $2,848 | $45,301 |
Source: Public Records
Map
Nearby Homes
- 205 Jefferson St
- 202 Jefferson St
- 1507 E 11th Place
- 503 Washington Blvd
- 1314 Birdwell Ln
- 304 Washington Blvd
- 1410 Sycamore St
- 1406 Virginia Ave
- 1410 Tucson Rd
- 1200 Michael Ave
- 1710 Alabama St
- 1201 Settles St
- 100 Washington Blvd
- 2004 N Monticello St
- 1302 Barnes Ave
- 1908 Morrison Dr
- 1313 Stadium Ave
- 1216 Ridgeroad Dr
- 1213 Ridgeroad Dr
- 706 Birdwell Ln
- 603 George St
- 605 George St
- 1109 Mount Vernon Ave
- 609 Washington Blvd
- 607 George St
- 1107 Mount Vernon Ave
- 1110 Mount Vernon Ave
- 1108 Mount Vernon Ave
- 609 George St
- 602 George St
- 1106 Mount Vernon Ave
- 1604 E 11th Place
- 605 Washington Blvd
- 1606 E 11th Place
- 703 Washington Blvd
- 1602 E 11th Place
- 1608 E 11th Place
- 1610 E 11th Place
- 1600 E 11th Place
- 1104 Mount Vernon Ave