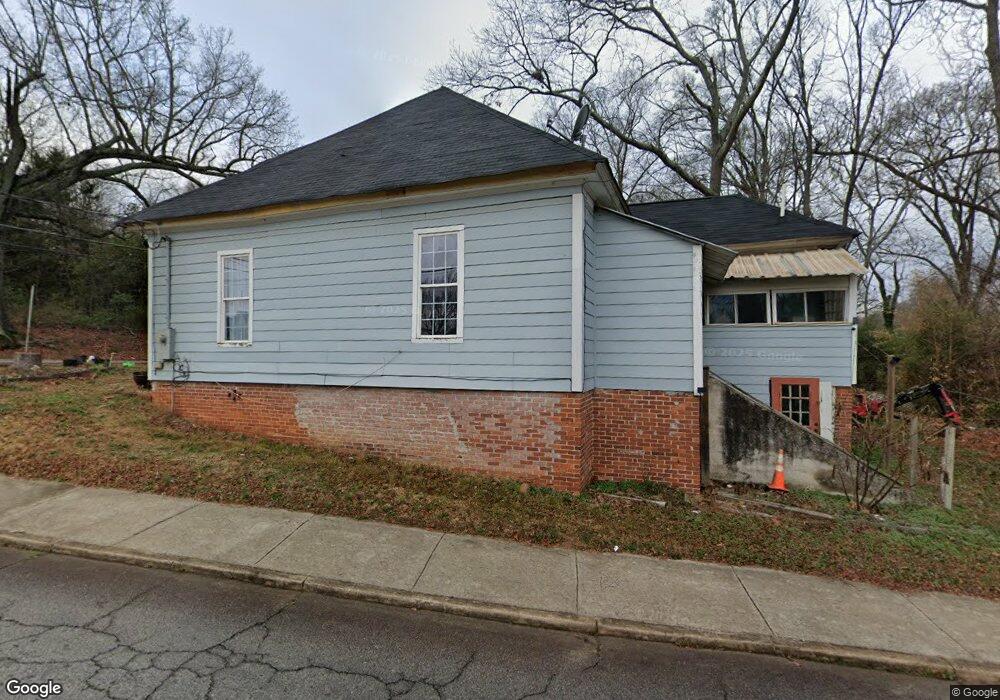
601 Hallyburton St Griffin, GA 30223
Spalding County NeighborhoodEstimated Value: $104,000 - $150,000
2
Beds
1
Bath
2,210
Sq Ft
$58/Sq Ft
Est. Value
About This Home
This home is located at 601 Hallyburton St, Griffin, GA 30223 and is currently estimated at $127,610, approximately $57 per square foot. 601 Hallyburton St is a home located in Spalding County with nearby schools including Atkinson Elementary School, Cowan Road Middle School, and Griffin High School.
Ownership History
Date
Name
Owned For
Owner Type
Purchase Details
Closed on
Nov 2, 2011
Sold by
Nuno Tatiana
Bought by
Sanchez Martin and Sanchez Virginia
Current Estimated Value
Purchase Details
Closed on
Feb 2, 2011
Sold by
J Durham Llc
Bought by
Nuno Tatiana and Hernandez Epifania
Purchase Details
Closed on
May 10, 2005
Sold by
Buckles Kenneth H
Bought by
Willis James D
Purchase Details
Closed on
Sep 17, 2004
Sold by
Buckles Kenneth H
Bought by
Johnson Kyle
Home Financials for this Owner
Home Financials are based on the most recent Mortgage that was taken out on this home.
Original Mortgage
$205,000
Interest Rate
5.73%
Purchase Details
Closed on
Dec 7, 1988
Sold by
Buckles Kenneth H
Bought by
Laster Cary
Purchase Details
Closed on
Jul 1, 1980
Sold by
Vaughn C Donald
Bought by
Buckles Kenneth H
Purchase Details
Closed on
Oct 26, 1979
Sold by
Kennedy Janelle C and Kennedy Colson E
Bought by
Vaughn C Donald
Purchase Details
Closed on
May 29, 1967
Sold by
Statham Alvin F
Bought by
Kennedy Janelle C and Kennedy Colson E
Purchase Details
Closed on
Nov 1, 1963
Sold by
Statham Alvin F
Bought by
Kennedy Janelle C and Kennedy Colson E
Create a Home Valuation Report for This Property
The Home Valuation Report is an in-depth analysis detailing your home's value as well as a comparison with similar homes in the area
Home Values in the Area
Average Home Value in this Area
Purchase History
| Date | Buyer | Sale Price | Title Company |
|---|---|---|---|
| Sanchez Martin | $3,500 | -- | |
| Nuno Tatiana | $3,000 | -- | |
| Willis James D | $110,000 | -- | |
| Johnson Kyle | $205,000 | -- | |
| Laster Cary | $66,000 | -- | |
| Buckles Kenneth H | -- | -- | |
| Buckles Kenneth H | $4,300 | -- | |
| Vaughn C Donald | -- | -- | |
| Kennedy Janelle C | -- | -- | |
| Kennedy Janelle C | -- | -- | |
| Statham Alvin F | $6,100 | -- |
Source: Public Records
Mortgage History
| Date | Status | Borrower | Loan Amount |
|---|---|---|---|
| Previous Owner | Johnson Kyle | $205,000 |
Source: Public Records
Tax History Compared to Growth
Tax History
| Year | Tax Paid | Tax Assessment Tax Assessment Total Assessment is a certain percentage of the fair market value that is determined by local assessors to be the total taxable value of land and additions on the property. | Land | Improvement |
|---|---|---|---|---|
| 2024 | $1,374 | $38,303 | $4,000 | $34,303 |
| 2023 | $1,374 | $37,503 | $3,200 | $34,303 |
| 2022 | $395 | $12,239 | $2,000 | $10,239 |
| 2021 | $362 | $11,419 | $2,000 | $9,419 |
| 2020 | $362 | $11,419 | $2,000 | $9,419 |
| 2019 | $459 | $13,639 | $1,800 | $11,839 |
| 2018 | $427 | $12,469 | $1,800 | $10,669 |
| 2017 | $417 | $12,469 | $1,800 | $10,669 |
| 2016 | $424 | $12,469 | $1,800 | $10,669 |
| 2015 | $431 | $12,469 | $1,800 | $10,669 |
| 2014 | $444 | $12,469 | $1,800 | $10,669 |
Source: Public Records
Map
Nearby Homes
- 200 AC W Ellis Rd
- 312.37 AC W Ellis Rd
- 637 Hallyburton St
- 525 W Quilly St
- 502 N 13th St
- 506 N 13th St
- 629 Williams St
- 411 Palace St
- 707 Williams St
- 435 W Cherry St
- 713 Williams St
- 730 Hallyburton St
- 566 N 13th St
- 333 N 10th St
- 325 W Quilly St
- 517 Belle St
- 321 N 10th St
- 533 Belle St
- 418 N 9th St
- 3939 Georgia Highway 3 Old Atl Rd
- 504 N 12th St
- 502 N 12th St
- 610 Hallyburton St
- 615 Hallyburton St
- 408 N 12th St
- 509 N 12th St
- 616 Hallyburton St
- 623 Hallyburton St
- 520 Wheeler St
- 520 Wheeler St Unit 64
- 523 Hallyburton St
- 609 Ellis St
- 402 N 12th St
- 621 Ellis St
- 605 Ellis St
- 519 Wheeler St
- 615 Ellis St
- 601 W Quilly St
- 531 N 12th St
- 624 Hallyburton St