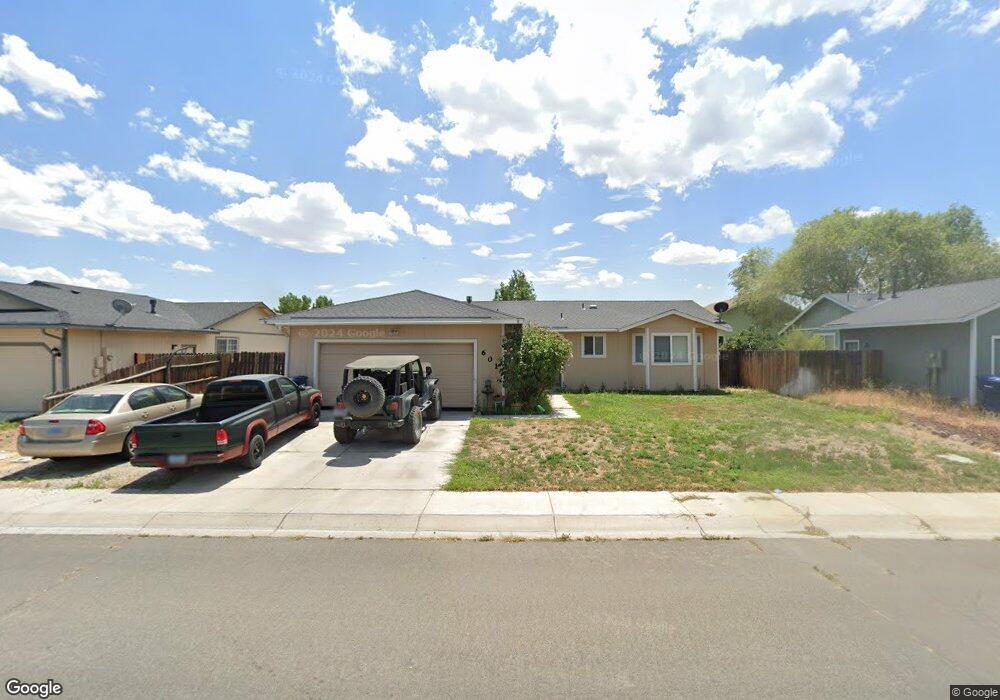
601 Nader Way Fernley, NV 89408
Estimated Value: $304,000 - $355,000
3
Beds
2
Baths
1,290
Sq Ft
$261/Sq Ft
Est. Value
About This Home
This home is located at 601 Nader Way, Fernley, NV 89408 and is currently estimated at $336,415, approximately $260 per square foot. 601 Nader Way is a home located in Lyon County with nearby schools including Cottonwood Elementary School, Fernley Intermediate School, and Fernley High School.
Ownership History
Date
Name
Owned For
Owner Type
Purchase Details
Closed on
Mar 29, 2010
Sold by
J T E K Investments Llc
Bought by
White Maynard J
Current Estimated Value
Home Financials for this Owner
Home Financials are based on the most recent Mortgage that was taken out on this home.
Original Mortgage
$64,800
Outstanding Balance
$43,031
Interest Rate
4.94%
Mortgage Type
New Conventional
Estimated Equity
$293,384
Purchase Details
Closed on
Jan 18, 2007
Sold by
Smith Gary L and Smith Judith A
Bought by
Jtek Investments Llc
Purchase Details
Closed on
Apr 25, 2005
Sold by
Kelso Julie C
Bought by
Smith Gary L and Smith Judith A
Home Financials for this Owner
Home Financials are based on the most recent Mortgage that was taken out on this home.
Original Mortgage
$169,600
Interest Rate
1.4%
Mortgage Type
Adjustable Rate Mortgage/ARM
Create a Home Valuation Report for This Property
The Home Valuation Report is an in-depth analysis detailing your home's value as well as a comparison with similar homes in the area
Home Values in the Area
Average Home Value in this Area
Purchase History
| Date | Buyer | Sale Price | Title Company |
|---|---|---|---|
| White Maynard J | $81,000 | First Centennial Title Co Of | |
| Jtek Investments Llc | -- | None Available | |
| Smith Gary L | $212,000 | First Centennial Title Co Nv |
Source: Public Records
Mortgage History
| Date | Status | Borrower | Loan Amount |
|---|---|---|---|
| Open | White Maynard J | $64,800 | |
| Previous Owner | Smith Gary L | $169,600 |
Source: Public Records
Tax History Compared to Growth
Tax History
| Year | Tax Paid | Tax Assessment Tax Assessment Total Assessment is a certain percentage of the fair market value that is determined by local assessors to be the total taxable value of land and additions on the property. | Land | Improvement |
|---|---|---|---|---|
| 2025 | $1,292 | $95,884 | $49,000 | $46,884 |
| 2024 | $1,663 | $96,315 | $49,000 | $47,314 |
| 2023 | $1,663 | $93,351 | $49,000 | $44,351 |
| 2022 | $1,571 | $90,096 | $49,000 | $41,096 |
| 2021 | $1,562 | $85,646 | $45,500 | $40,146 |
| 2020 | $1,524 | $68,171 | $29,750 | $38,421 |
| 2019 | $1,507 | $66,889 | $29,750 | $37,139 |
| 2018 | $1,479 | $60,753 | $24,500 | $36,253 |
| 2017 | $1,481 | $53,801 | $17,500 | $36,301 |
| 2016 | $1,298 | $41,050 | $5,780 | $35,270 |
| 2015 | $1,334 | $31,524 | $5,780 | $25,744 |
| 2014 | $1,306 | $27,387 | $5,780 | $21,607 |
Source: Public Records
Map
Nearby Homes