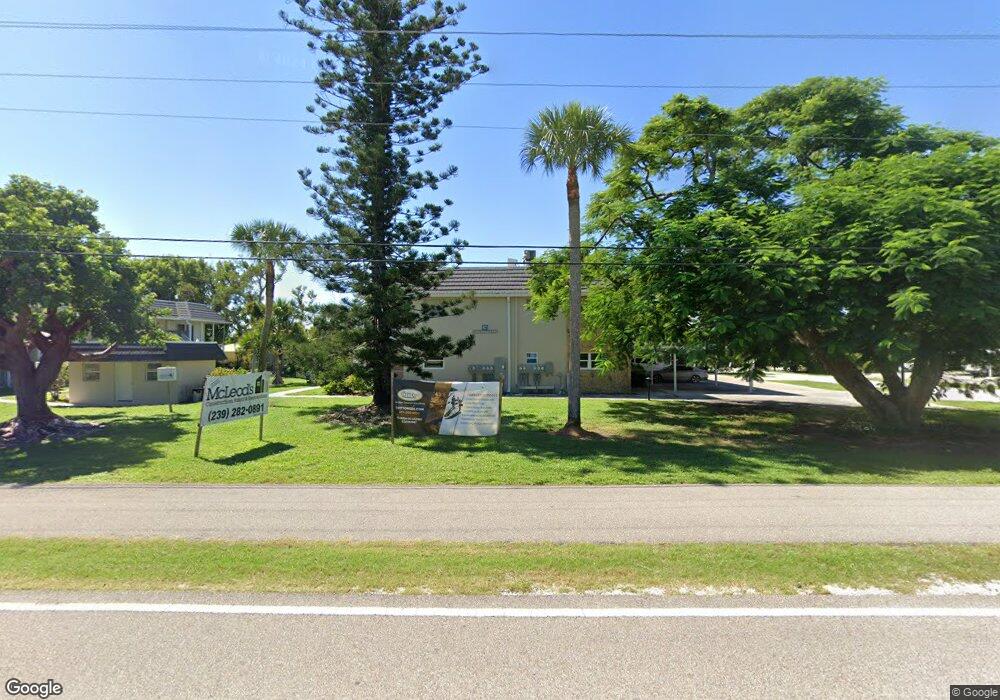
601 Periwinkle Way Unit D7 Sanibel, FL 33957
Estimated Value: $262,000 - $371,000
1
Bed
1
Bath
638
Sq Ft
$506/Sq Ft
Est. Value
About This Home
This home is located at 601 Periwinkle Way Unit D7, Sanibel, FL 33957 and is currently estimated at $323,058, approximately $506 per square foot. 601 Periwinkle Way Unit D7 is a home located in Lee County with nearby schools including Sanibel Elementary School, Cypress Lake Middle School, and Cypress Lake High School.
Ownership History
Date
Name
Owned For
Owner Type
Purchase Details
Closed on
Jun 17, 2003
Sold by
Foster Joseph E and Lillydale Susan M
Bought by
Foster Joseph E
Current Estimated Value
Home Financials for this Owner
Home Financials are based on the most recent Mortgage that was taken out on this home.
Original Mortgage
$80,000
Outstanding Balance
$34,153
Interest Rate
5.43%
Estimated Equity
$288,905
Purchase Details
Closed on
Apr 30, 1999
Sold by
Mcelroy Colleen
Bought by
Foster Joseph E and Lillydale Susan M
Home Financials for this Owner
Home Financials are based on the most recent Mortgage that was taken out on this home.
Original Mortgage
$89,600
Interest Rate
7%
Purchase Details
Closed on
Aug 14, 1997
Sold by
Stevens Sophie Trent and Stevens Md Sophie Trent
Bought by
Mcelroy Colleen
Home Financials for this Owner
Home Financials are based on the most recent Mortgage that was taken out on this home.
Original Mortgage
$77,680
Interest Rate
7.56%
Create a Home Valuation Report for This Property
The Home Valuation Report is an in-depth analysis detailing your home's value as well as a comparison with similar homes in the area
Home Values in the Area
Average Home Value in this Area
Purchase History
| Date | Buyer | Sale Price | Title Company |
|---|---|---|---|
| Foster Joseph E | -- | -- | |
| Foster Joseph E | -- | -- | |
| Foster Joseph E | $112,000 | -- | |
| Mcelroy Colleen | $80,000 | -- |
Source: Public Records
Mortgage History
| Date | Status | Borrower | Loan Amount |
|---|---|---|---|
| Open | Foster Joseph E | $80,000 | |
| Closed | Foster Joseph E | $80,000 | |
| Previous Owner | Foster Joseph E | $89,600 | |
| Previous Owner | Mcelroy Colleen | $77,680 |
Source: Public Records
Tax History Compared to Growth
Tax History
| Year | Tax Paid | Tax Assessment Tax Assessment Total Assessment is a certain percentage of the fair market value that is determined by local assessors to be the total taxable value of land and additions on the property. | Land | Improvement |
|---|---|---|---|---|
| 2025 | $134 | $183,815 | -- | -- |
| 2024 | $134 | $33,246 | -- | $33,246 |
| 2023 | $134 | $33,131 | $0 | $33,131 |
| 2022 | $1,846 | $168,380 | $0 | $0 |
| 2021 | $1,856 | $182,441 | $0 | $182,441 |
| 2020 | $1,838 | $161,219 | $0 | $0 |
| 2019 | $1,801 | $157,594 | $0 | $0 |
| 2018 | $1,798 | $154,656 | $0 | $0 |
| 2017 | $1,794 | $151,475 | $0 | $0 |
| 2016 | $1,779 | $148,359 | $0 | $148,359 |
| 2015 | $2,138 | $133,800 | $0 | $133,800 |
| 2014 | -- | $130,400 | $0 | $130,400 |
| 2013 | -- | $119,500 | $0 | $119,500 |
Source: Public Records
Map
Nearby Homes
- 641 Periwinkle Way Unit A3
- 1062 S Yachtsman Dr
- 1113 Skiff Place
- 1105 Skiff Place
- 601 Periwinkle Way Unit D1
- 561 Periwinkle Way Unit E2
- 732 Windlass Way
- 761 Limpet Dr
- 748 Windlass Way
- 931 S Yachtsman Dr
- 1133 Golden Olive Ct
- 734 Anchor Dr
- 755 Pen Shell Dr
- 592 Lighthouse Way
- 628 Lighthouse Way
- 500 Kinzie Island Ct
- 601 Periwinkle Way Unit D2
- 601 Periwinkle Way Unit C7
- 601 Periwinkle Way Unit D8
- 601 Periwinkle Way Unit C8
- 601 Periwinkle Way Unit C1
- 601 Periwinkle Way Unit D3
- 601 Periwinkle Way Unit C2
- 601 Periwinkle Way Unit C5
- 601 Periwinkle Way Unit D6
- 601 Periwinkle Way Unit D5
- 601 Periwinkle Way Unit C4
- 601 Periwinkle Way Unit D4
- 601 Periwinkle Way Unit C3
- 1121 Skiff Place
- 1120 Skiff Place
- 1113 Skiff Place Unit 27
- 1117 Captains Walk St
- 610 Periwinkle Way
- 1112 Skiff Place
- 630 Periwinkle Way