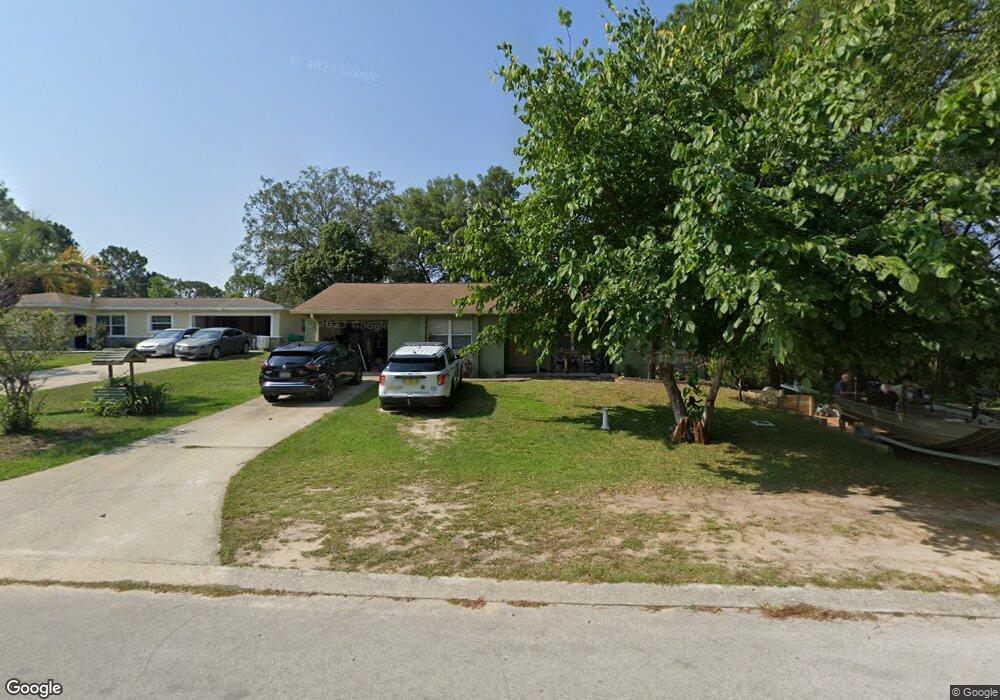
601 Pineaire St Inverness, FL 34452
Estimated Value: $202,431 - $213,000
3
Beds
2
Baths
1,202
Sq Ft
$173/Sq Ft
Est. Value
About This Home
This home is located at 601 Pineaire St, Inverness, FL 34452 and is currently estimated at $208,358, approximately $173 per square foot. 601 Pineaire St is a home located in Citrus County with nearby schools including Inverness Primary School, Inverness Middle School, and Citrus High School.
Ownership History
Date
Name
Owned For
Owner Type
Purchase Details
Closed on
Feb 9, 2010
Sold by
Junker L Michael
Bought by
Junker L Michael and Junker Alison
Current Estimated Value
Purchase Details
Closed on
Nov 20, 2008
Sold by
Primacy Closing Corporation
Bought by
Ruby Samuel J
Home Financials for this Owner
Home Financials are based on the most recent Mortgage that was taken out on this home.
Original Mortgage
$93,978
Outstanding Balance
$61,750
Interest Rate
6.1%
Mortgage Type
VA
Estimated Equity
$146,608
Purchase Details
Closed on
May 31, 2007
Sold by
Wagoner Roger L
Bought by
Primacy Closing Corp
Purchase Details
Closed on
Oct 14, 2005
Sold by
Robson David W and Robson Norma
Bought by
Wagoner Roger L
Home Financials for this Owner
Home Financials are based on the most recent Mortgage that was taken out on this home.
Original Mortgage
$126,100
Interest Rate
5.38%
Mortgage Type
Purchase Money Mortgage
Purchase Details
Closed on
May 1, 1998
Bought by
Ruby Samuel J
Purchase Details
Closed on
Feb 1, 1988
Bought by
Ruby Samuel J
Purchase Details
Closed on
Sep 1, 1987
Bought by
Ruby Samuel J
Create a Home Valuation Report for This Property
The Home Valuation Report is an in-depth analysis detailing your home's value as well as a comparison with similar homes in the area
Home Values in the Area
Average Home Value in this Area
Purchase History
| Date | Buyer | Sale Price | Title Company |
|---|---|---|---|
| Junker L Michael | -- | Attorney | |
| Ruby Samuel J | $92,000 | Resource Title Company Inc | |
| Primacy Closing Corp | $130,700 | Resource Title Company Inc | |
| Wagoner Roger L | $130,000 | Sunbelt Title Agency | |
| Ruby Samuel J | $50,000 | -- | |
| Ruby Samuel J | $54,700 | -- | |
| Ruby Samuel J | $3,300 | -- |
Source: Public Records
Mortgage History
| Date | Status | Borrower | Loan Amount |
|---|---|---|---|
| Open | Ruby Samuel J | $93,978 | |
| Previous Owner | Wagoner Roger L | $126,100 |
Source: Public Records
Tax History Compared to Growth
Tax History
| Year | Tax Paid | Tax Assessment Tax Assessment Total Assessment is a certain percentage of the fair market value that is determined by local assessors to be the total taxable value of land and additions on the property. | Land | Improvement |
|---|---|---|---|---|
| 2024 | $558 | $54,999 | -- | -- |
| 2023 | $558 | $53,397 | $0 | $0 |
| 2022 | $536 | $51,842 | $0 | $0 |
| 2021 | $523 | $50,332 | $0 | $0 |
| 2020 | $462 | $89,262 | $3,520 | $85,742 |
| 2019 | $451 | $89,440 | $3,520 | $85,920 |
| 2018 | $420 | $75,354 | $3,200 | $72,154 |
| 2017 | $413 | $46,637 | $2,840 | $43,797 |
| 2016 | $411 | $45,678 | $2,580 | $43,098 |
| 2015 | $409 | $45,360 | $2,310 | $43,050 |
| 2014 | $415 | $45,000 | $3,931 | $41,069 |
Source: Public Records
Map
Nearby Homes
- 615 E Inverness Blvd
- 515 Oak St
- 1037 Fordham Terrace
- 105 E Inverness Blvd
- 729 Desota Ave
- 827 Hickory Ave
- 1032 Lowell Terrace
- 1030 Dartmouth Terrace
- 910 Spruce St
- 319 Vassar St
- 1146 S Highlands Ave
- 318 Temple St
- 943 Maple Ave
- 810 Eden Dr
- 1155 S Cornell Terrace
- 305 Edison St
- 317 Blanche St
- 920 Yale Ln
- 1116 E Harvard St
- 3118 S Florida Ave