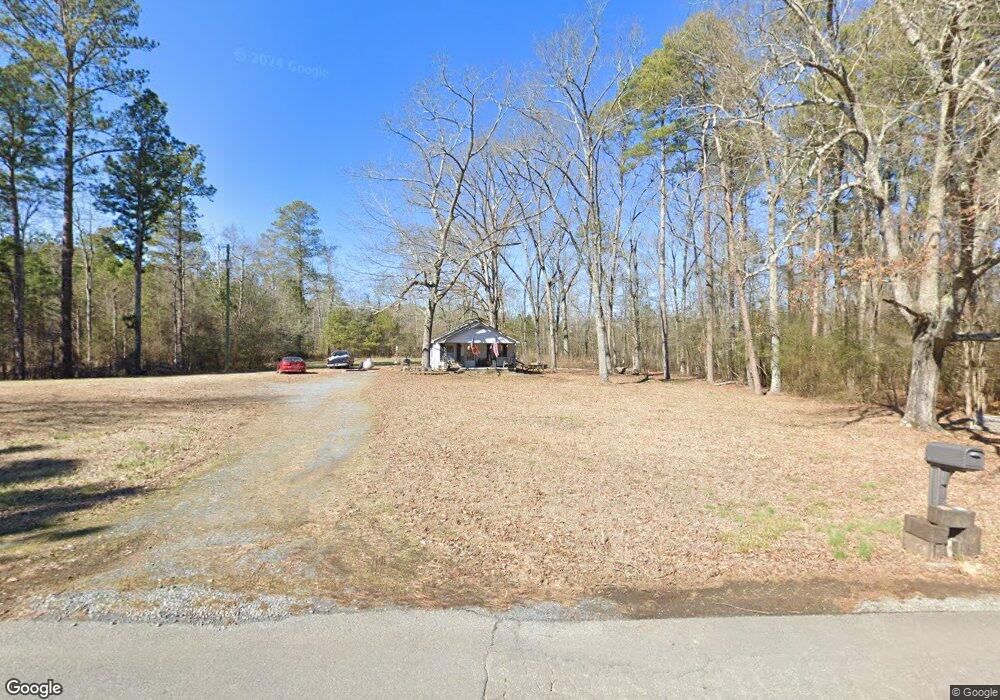
601 Rosedale Rd NE Armuchee, GA 30105
Estimated Value: $104,827 - $275,000
--
Bed
--
Bath
960
Sq Ft
$195/Sq Ft
Est. Value
About This Home
This home is located at 601 Rosedale Rd NE, Armuchee, GA 30105 and is currently estimated at $186,957, approximately $194 per square foot. 601 Rosedale Rd NE is a home located in Floyd County with nearby schools including Armuchee Middle School and Armuchee High School.
Ownership History
Date
Name
Owned For
Owner Type
Purchase Details
Closed on
Feb 4, 2005
Sold by
Duke James David
Bought by
Duke Jason David
Current Estimated Value
Home Financials for this Owner
Home Financials are based on the most recent Mortgage that was taken out on this home.
Original Mortgage
$57,103
Outstanding Balance
$28,910
Interest Rate
5.69%
Mortgage Type
FHA
Estimated Equity
$158,047
Purchase Details
Closed on
Jan 31, 2005
Bought by
P and R
Home Financials for this Owner
Home Financials are based on the most recent Mortgage that was taken out on this home.
Original Mortgage
$57,103
Outstanding Balance
$28,910
Interest Rate
5.69%
Mortgage Type
FHA
Estimated Equity
$158,047
Purchase Details
Closed on
Jun 17, 1999
Sold by
Duke Ruth T
Bought by
Duke James David
Purchase Details
Closed on
Feb 5, 1998
Sold by
Duke J Albert
Bought by
Duke Ruth T
Purchase Details
Closed on
Apr 29, 1982
Bought by
P and R
Purchase Details
Closed on
Jan 1, 1950
Bought by
Duke J Albert
Create a Home Valuation Report for This Property
The Home Valuation Report is an in-depth analysis detailing your home's value as well as a comparison with similar homes in the area
Home Values in the Area
Average Home Value in this Area
Purchase History
| Date | Buyer | Sale Price | Title Company |
|---|---|---|---|
| Duke Jason David | $58,000 | -- | |
| P | -- | -- | |
| Duke James David | -- | -- | |
| Duke Ruth T | -- | -- | |
| P | $500 | -- | |
| Duke J Albert | -- | -- |
Source: Public Records
Mortgage History
| Date | Status | Borrower | Loan Amount |
|---|---|---|---|
| Open | Duke Jason David | $57,103 |
Source: Public Records
Tax History Compared to Growth
Tax History
| Year | Tax Paid | Tax Assessment Tax Assessment Total Assessment is a certain percentage of the fair market value that is determined by local assessors to be the total taxable value of land and additions on the property. | Land | Improvement |
|---|---|---|---|---|
| 2024 | $1,318 | $42,218 | $13,209 | $29,009 |
| 2023 | $1,208 | $40,383 | $12,008 | $28,375 |
| 2022 | $953 | $32,127 | $9,986 | $22,141 |
| 2021 | $773 | $25,609 | $9,107 | $16,502 |
| 2020 | $721 | $23,676 | $7,919 | $15,757 |
| 2019 | $687 | $22,864 | $7,919 | $14,945 |
| 2018 | $648 | $21,526 | $7,542 | $13,984 |
| 2017 | $619 | $20,548 | $6,984 | $13,564 |
| 2016 | $521 | $17,090 | $6,960 | $10,130 |
| 2015 | $510 | $17,090 | $6,960 | $10,130 |
| 2014 | $510 | $17,090 | $6,960 | $10,130 |
Source: Public Records
Map
Nearby Homes
- 2324 Floyd Springs Rd NE
- 1465 Turner Rd NE
- 334 Armuchee Trail NE
- 1603 Floyd Springs Rd NE
- 311 Herring Rd NE
- 5452 Old Dalton Rd NE
- 1194 New Rosedale Rd NE
- 4569 Old Dalton Rd NE
- 1085 New Rosedale Rd NE
- 1434 Culpepper Rd NE
- 1024 New Rosedale Rd NE
- 49 Southern Woods Dr NE
- 282 Turner Rd NE
- 201 Kellett Rd NE
- 1216 Everett Springs Rd NE
- 0 Culpepper Rd NE Unit 7592082
- 0 Culpepper Rd NE Unit 7651484
- 0 Culpepper Rd NE Unit TRACT 1 & 2 10607389
- 0 Culpepper Rd NE Unit 10536672
- 0 Rosedale Rd Unit 3234607
- 0 Rosedale Rd Unit 3203210
- 0 Rosedale Rd Unit 8749535
- 0 Rosedale Rd Unit 8127220
- 0 Rosedale Rd
- 633 Rosedale Rd NE
- 548 Rosedale Rd NE
- 545 Rosedale Rd NE
- 36 Vernon Rd NE
- 567 Rosedale Rd NE
- 517 Rosedale Rd NE
- 691 Rosedale Rd NE
- 686 Rosedale Rd NE
- 68 Vernon Rd NE
- 461 Rosedale Rd NE
- 459 Rosedale Rd NE
- 103 Vernon Rd NE
- 94 Vernon Rd NE
- 448 Rosedale Rd NE
- 500 Rosedale Rd NE