Estimated Value: $86,739 - $131,000
3
Beds
2
Baths
1,176
Sq Ft
$93/Sq Ft
Est. Value
About This Home
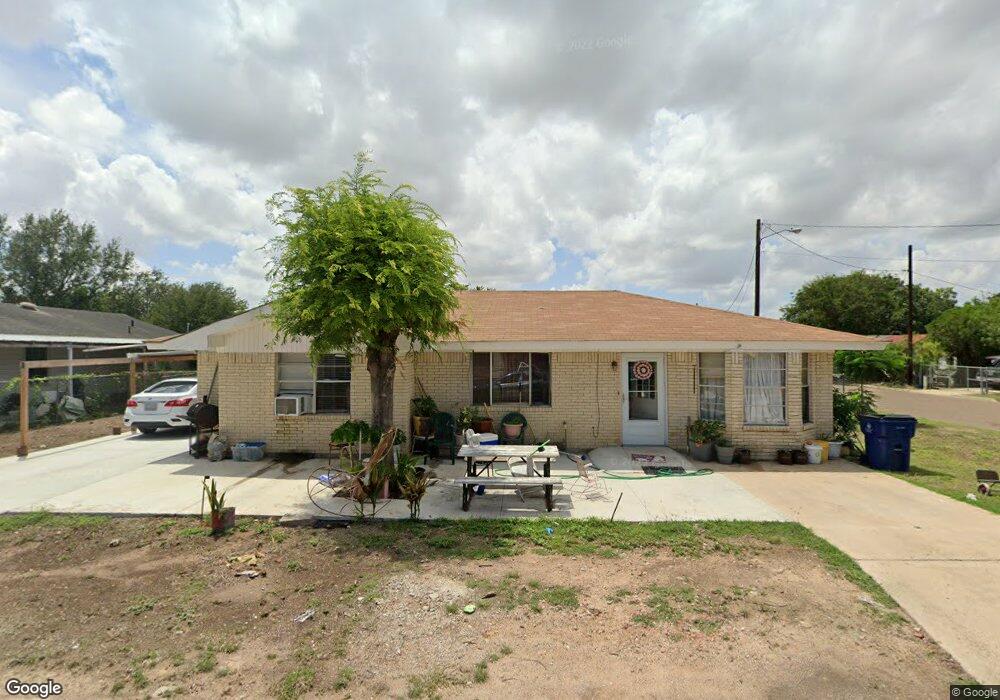
This home is located at 601 S 21st St, Donna, TX 78537 and is currently estimated at $109,935, approximately $93 per square foot. 601 S 21st St is a home located in Hidalgo County with nearby schools including Guzman Elementary School, W.A. Todd Middle School, and Donna High School.
Ownership History
Date
Name
Owned For
Owner Type
Purchase Details
Closed on
Mar 18, 2024
Sold by
Chapa Laura Marlen
Bought by
Muniz Richard
Current Estimated Value
Home Financials for this Owner
Home Financials are based on the most recent Mortgage that was taken out on this home.
Original Mortgage
$35,000
Outstanding Balance
$34,447
Interest Rate
6.9%
Mortgage Type
New Conventional
Estimated Equity
$75,488
Purchase Details
Closed on
Dec 6, 2022
Sold by
Leyva Nieves
Bought by
Chapa Laura Marlen
Create a Home Valuation Report for This Property
The Home Valuation Report is an in-depth analysis detailing your home's value as well as a comparison with similar homes in the area
Home Values in the Area
Average Home Value in this Area
Purchase History
| Date | Buyer | Sale Price | Title Company |
|---|---|---|---|
| Muniz Richard | -- | None Listed On Document | |
| Chapa Laura Marlen | -- | -- |
Source: Public Records
Mortgage History
| Date | Status | Borrower | Loan Amount |
|---|---|---|---|
| Open | Muniz Richard | $35,000 |
Source: Public Records
Tax History Compared to Growth
Tax History
| Year | Tax Paid | Tax Assessment Tax Assessment Total Assessment is a certain percentage of the fair market value that is determined by local assessors to be the total taxable value of land and additions on the property. | Land | Improvement |
|---|---|---|---|---|
| 2025 | $484 | $24,195 | $24,000 | $195 |
| 2024 | $484 | $24,195 | $24,000 | $195 |
| 2023 | $636 | $24,180 | $24,000 | $180 |
| 2022 | $360 | $12,980 | $12,800 | $180 |
| 2021 | $365 | $12,950 | $12,800 | $150 |
| 2020 | $1,627 | $55,771 | $23,432 | $42,808 |
| 2019 | $1,500 | $50,701 | $20,200 | $30,501 |
| 2018 | $1,504 | $50,701 | $20,200 | $30,501 |
| 2017 | $1,588 | $50,243 | $20,200 | $30,501 |
| 2016 | $1,443 | $45,675 | $16,160 | $29,515 |
| 2015 | $991 | $45,675 | $16,160 | $29,515 |
Source: Public Records
Map
Nearby Homes