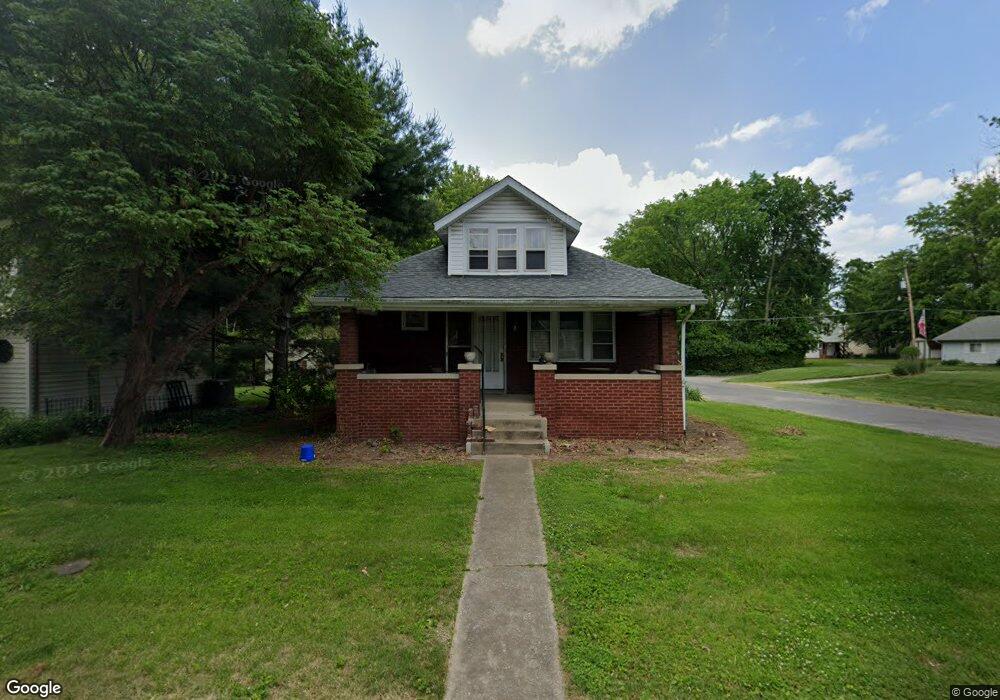
601 S 22nd St Belleville, IL 62226
Estimated Value: $103,000 - $148,000
Studio
--
Bath
1,108
Sq Ft
$111/Sq Ft
Est. Value
About This Home
This home is located at 601 S 22nd St, Belleville, IL 62226 and is currently estimated at $123,183, approximately $111 per square foot. 601 S 22nd St is a home located in St. Clair County with nearby schools including Union Elementary School, West Jr High School, and Governor French Academy.
Ownership History
Date
Name
Owned For
Owner Type
Purchase Details
Closed on
Jan 7, 2008
Sold by
Heafner Frank and Surber Thom
Bought by
Bien Amanda K
Current Estimated Value
Home Financials for this Owner
Home Financials are based on the most recent Mortgage that was taken out on this home.
Original Mortgage
$91,857
Outstanding Balance
$58,314
Interest Rate
6.27%
Mortgage Type
FHA
Estimated Equity
$64,869
Purchase Details
Closed on
Jun 20, 2005
Sold by
Bergmann Vivienne
Bought by
Heafner Frank and Surber Tom
Home Financials for this Owner
Home Financials are based on the most recent Mortgage that was taken out on this home.
Original Mortgage
$60,000
Interest Rate
6.44%
Mortgage Type
Purchase Money Mortgage
Purchase Details
Closed on
Sep 16, 2003
Sold by
Scobbie Alexander W and Scobbie Edna E
Bought by
Scobbie Alexander W and Scobbie Edna E
Create a Home Valuation Report for This Property
The Home Valuation Report is an in-depth analysis detailing your home's value as well as a comparison with similar homes in the area
Home Values in the Area
Average Home Value in this Area
Purchase History
| Date | Buyer | Sale Price | Title Company |
|---|---|---|---|
| Bien Amanda K | $93,000 | Fatic | |
| Heafner Frank | $45,000 | Chicago Title | |
| Scobbie Alexander W | -- | -- |
Source: Public Records
Mortgage History
| Date | Status | Borrower | Loan Amount |
|---|---|---|---|
| Open | Bien Amanda K | $91,857 | |
| Previous Owner | Heafner Frank | $60,000 |
Source: Public Records
Tax History
| Year | Tax Paid | Tax Assessment Tax Assessment Total Assessment is a certain percentage of the fair market value that is determined by local assessors to be the total taxable value of land and additions on the property. | Land | Improvement |
|---|---|---|---|---|
| 2024 | $2,452 | $33,889 | $3,340 | $30,549 |
| 2023 | $2,253 | $30,001 | $3,275 | $26,726 |
| 2022 | $2,011 | $27,008 | $2,948 | $24,060 |
| 2021 | $1,891 | $24,968 | $2,725 | $22,243 |
| 2020 | $1,813 | $23,611 | $2,577 | $21,034 |
| 2019 | $2,075 | $26,033 | $2,580 | $23,453 |
| 2018 | $2,016 | $25,470 | $2,524 | $22,946 |
| 2017 | $2,002 | $25,291 | $2,507 | $22,784 |
| 2016 | $1,971 | $24,754 | $2,454 | $22,300 |
| 2014 | $1,937 | $26,945 | $2,524 | $24,421 |
| 2013 | $1,966 | $27,330 | $2,560 | $24,770 |
Source: Public Records
Map
Nearby Homes
Your Personal Tour Guide
Ask me questions while you tour the home.