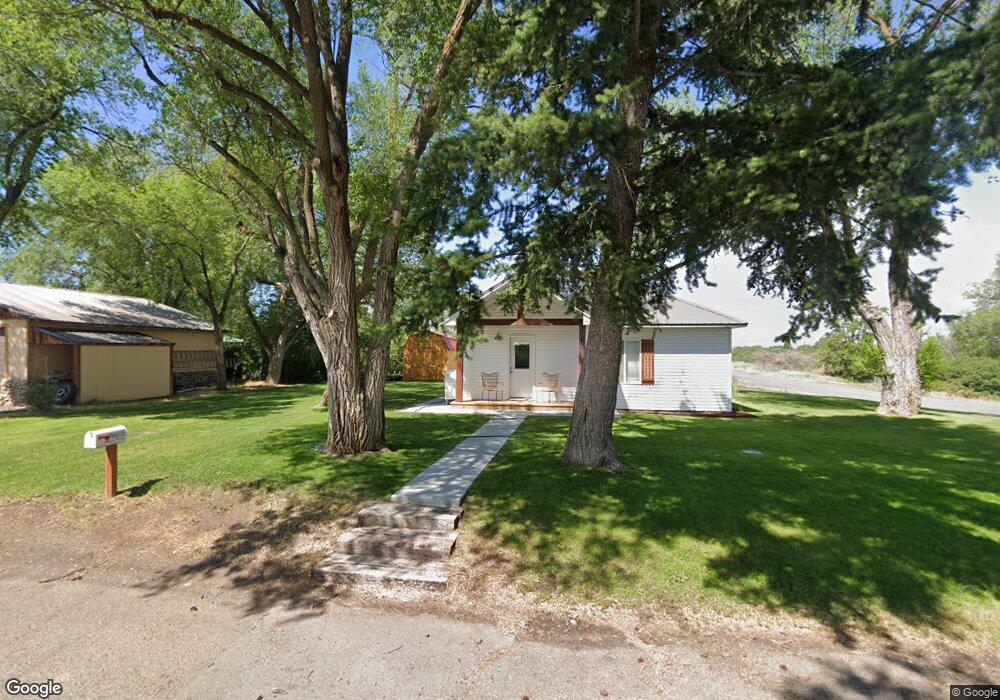
601 S 4th W Saint Anthony, ID 83445
Estimated Value: $211,000 - $227,112
2
Beds
1
Bath
892
Sq Ft
$249/Sq Ft
Est. Value
About This Home
This home is located at 601 S 4th W, Saint Anthony, ID 83445 and is currently estimated at $222,528, approximately $249 per square foot. 601 S 4th W is a home located in Fremont County with nearby schools including Henrys Fork Elementary School, South Fremont Junior High School, and South Fremont High School.
Ownership History
Date
Name
Owned For
Owner Type
Purchase Details
Closed on
Jul 30, 2019
Sold by
Bauer Chad J and Bauer Gail G
Bought by
Paynter Cayman D
Current Estimated Value
Home Financials for this Owner
Home Financials are based on the most recent Mortgage that was taken out on this home.
Original Mortgage
$126,798
Outstanding Balance
$83,862
Interest Rate
3.8%
Mortgage Type
New Conventional
Estimated Equity
$138,666
Purchase Details
Closed on
Jan 9, 2019
Sold by
Himle Nils D and Himle Michelle J
Bought by
Bauer Chad J and Bauer Gail G
Purchase Details
Closed on
Sep 27, 2017
Sold by
Bane Roxanne and Estate Of James G Gerber
Bought by
Himle Nils D and Himle Michelle J
Home Financials for this Owner
Home Financials are based on the most recent Mortgage that was taken out on this home.
Original Mortgage
$77,900
Interest Rate
3.89%
Mortgage Type
New Conventional
Create a Home Valuation Report for This Property
The Home Valuation Report is an in-depth analysis detailing your home's value as well as a comparison with similar homes in the area
Home Values in the Area
Average Home Value in this Area
Purchase History
| Date | Buyer | Sale Price | Title Company |
|---|---|---|---|
| Paynter Cayman D | -- | Alliance Ttl Rexburg Office | |
| Bauer Chad J | $48,000 | None Available | |
| Himle Nils D | -- | Amerititle |
Source: Public Records
Mortgage History
| Date | Status | Borrower | Loan Amount |
|---|---|---|---|
| Open | Paynter Cayman D | $126,798 | |
| Previous Owner | Himle Nils D | $77,900 |
Source: Public Records
Tax History
| Year | Tax Paid | Tax Assessment Tax Assessment Total Assessment is a certain percentage of the fair market value that is determined by local assessors to be the total taxable value of land and additions on the property. | Land | Improvement |
|---|---|---|---|---|
| 2025 | $642 | $63,233 | $20,769 | $42,464 |
| 2024 | $637 | $62,003 | $20,769 | $41,234 |
| 2023 | $607 | $62,003 | $20,769 | $41,234 |
| 2022 | $777 | $52,171 | $20,769 | $31,402 |
| 2021 | $729 | $37,779 | $11,329 | $26,450 |
| 2020 | $740 | $35,956 | $11,329 | $24,627 |
| 2019 | $737 | $35,954 | $11,329 | $24,625 |
| 2018 | $709 | $32,082 | $11,329 | $20,753 |
| 2017 | $7 | $26,676 | $10,989 | $15,687 |
| 2016 | $743 | $26,676 | $10,989 | $15,687 |
| 2015 | $735 | $53,353 | $0 | $0 |
| 2014 | $524 | $26,676 | $0 | $0 |
| 2013 | $524 | $26,676 | $0 | $0 |
Source: Public Records
Map
Nearby Homes
- 255 W 6th S
- 235 W 6th S
- 906 S Bridge St
- 238 W Main St
- 745 W Main St
- TBD 8th St
- 645 W 1st N
- 2985 Edgewater Ln
- 1112 Home Run Ave
- 1118 Home Run Ave
- 1120 Home Run Ave
- 415 Juniper View Ave
- 530 N 6th W
- 130 Industrial Park Rd
- 120 Industrial Park Rd
- 595 Bechler St
- 545 Elm Ave Unit 18
- TBD 2511 Del Rio Way
- 2546 E 600 N
- Lot 4 N 2565 E