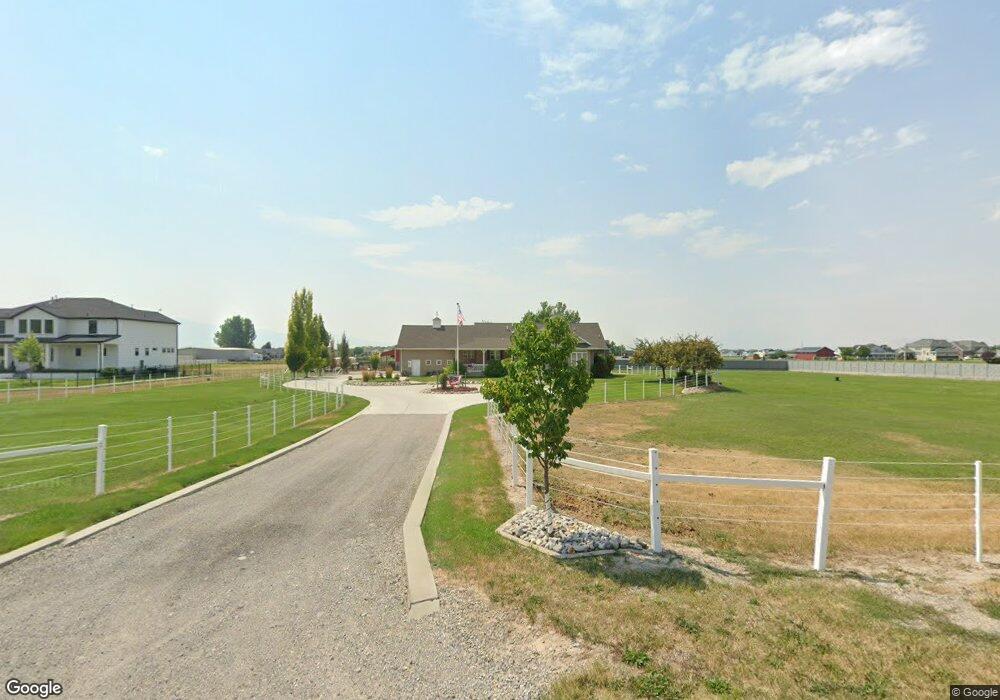
601 S 50 E Hyde Park, UT 84318
Estimated Value: $633,000 - $1,086,511
Studio
--
Bath
1,830
Sq Ft
$439/Sq Ft
Est. Value
About This Home
This home is located at 601 S 50 E, Hyde Park, UT 84318 and is currently estimated at $803,128, approximately $438 per square foot. 601 S 50 E is a home with nearby schools including North Park School, Cedar Ridge School, and North Cache Middle School.
Ownership History
Date
Name
Owned For
Owner Type
Purchase Details
Closed on
Jan 22, 2020
Sold by
Brenty R Kathy Downs Trust
Bought by
Hyde Park City
Current Estimated Value
Purchase Details
Closed on
Feb 10, 2015
Sold by
Downs Brent R and Downs Kathy
Bought by
Brent R Downs & Kathy Downs Revocable Tr
Purchase Details
Closed on
Sep 2, 2010
Sold by
Downs Brent R and Downs Kathy
Bought by
Downs Brent R and Downs Kathy
Home Financials for this Owner
Home Financials are based on the most recent Mortgage that was taken out on this home.
Original Mortgage
$128,000
Interest Rate
3.95%
Mortgage Type
New Conventional
Purchase Details
Closed on
Mar 17, 2010
Sold by
Seamons Downs Brent Robert and Seamons Downs Kathy
Bought by
Downs Brent R and Downs Kathy
Create a Home Valuation Report for This Property
The Home Valuation Report is an in-depth analysis detailing your home's value as well as a comparison with similar homes in the area
Home Values in the Area
Average Home Value in this Area
Purchase History
| Date | Buyer | Sale Price | Title Company |
|---|---|---|---|
| Hyde Park City | -- | None Available | |
| Brent R Downs & Kathy Downs Revocable Tr | -- | Hickman Land Title Company | |
| Downs Brent R | -- | Hickman Land Title Company | |
| Downs Brent R | -- | Hickman Land Title Company | |
| Downs Brent R | -- | Hickman Land Title Company | |
| Downs Brent R | -- | None Available |
Source: Public Records
Mortgage History
| Date | Status | Borrower | Loan Amount |
|---|---|---|---|
| Previous Owner | Downs Brent R | $128,000 |
Source: Public Records
Tax History
| Year | Tax Paid | Tax Assessment Tax Assessment Total Assessment is a certain percentage of the fair market value that is determined by local assessors to be the total taxable value of land and additions on the property. | Land | Improvement |
|---|---|---|---|---|
| 2025 | $3,066 | $422,705 | $0 | $0 |
| 2024 | $329 | $418,535 | $0 | $0 |
| 2023 | $3,126 | $377,975 | $0 | $0 |
| 2022 | $3,251 | $378,005 | $0 | $0 |
| 2021 | $3,176 | $744,390 | $297,300 | $447,090 |
| 2020 | $2,769 | $661,330 | $312,500 | $348,830 |
| 2019 | $2,918 | $661,330 | $312,500 | $348,830 |
| 2018 | $2,518 | $511,600 | $206,000 | $305,600 |
| 2017 | $2,463 | $209,570 | $0 | $0 |
| 2016 | $2,498 | $209,505 | $0 | $0 |
| 2015 | $2,059 | $174,510 | $0 | $0 |
| 2014 | $2,008 | $174,675 | $0 | $0 |
| 2013 | -- | $174,905 | $0 | $0 |
Source: Public Records
Map
Nearby Homes
Your Personal Tour Guide
Ask me questions while you tour the home.