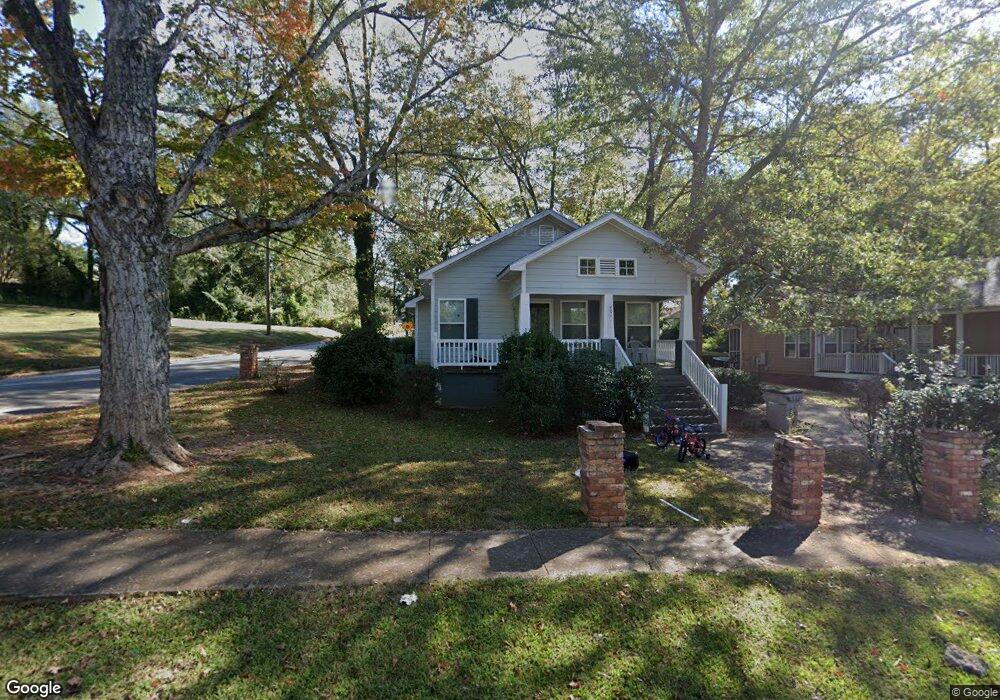
601 S Lee St Lagrange, GA 30240
Estimated Value: $142,747 - $174,000
3
Beds
2
Baths
1,130
Sq Ft
$140/Sq Ft
Est. Value
About This Home
This home is located at 601 S Lee St, Lagrange, GA 30240 and is currently estimated at $157,687, approximately $139 per square foot. 601 S Lee St is a home located in Troup County with nearby schools including Ethel W. Kight Elementary School, Hollis Hand Elementary School, and Franklin Forest Elementary School.
Ownership History
Date
Name
Owned For
Owner Type
Purchase Details
Closed on
Jul 7, 2015
Sold by
Mckenley Willie
Bought by
Hutchinson Investments Llc
Current Estimated Value
Purchase Details
Closed on
Apr 24, 2006
Sold by
Dash For Lagrange Inc
Bought by
Mckenley Willie
Home Financials for this Owner
Home Financials are based on the most recent Mortgage that was taken out on this home.
Original Mortgage
$85,285
Interest Rate
6.28%
Mortgage Type
FHA
Purchase Details
Closed on
Jul 8, 2005
Sold by
Pace Clinton R
Bought by
Dash For Lagrange Inc
Purchase Details
Closed on
Jan 1, 1989
Bought by
Angela Clinton R and Angela Pace
Purchase Details
Closed on
Oct 31, 1980
Purchase Details
Closed on
Jun 8, 1978
Purchase Details
Closed on
Feb 18, 1977
Purchase Details
Closed on
Jan 1, 1972
Purchase Details
Closed on
Jan 1, 1945
Create a Home Valuation Report for This Property
The Home Valuation Report is an in-depth analysis detailing your home's value as well as a comparison with similar homes in the area
Purchase History
| Date | Buyer | Sale Price | Title Company |
|---|---|---|---|
| Hutchinson Investments Llc | $40,851 | -- | |
| Mckenley Willie | $118,000 | -- | |
| Dash For Lagrange Inc | $29,400 | -- | |
| Angela Clinton R | $22,800 | -- | |
| Angela Clinton R | $22,800 | -- | |
| -- | $4,100 | -- | |
| -- | $22,800 | -- | |
| -- | $17,600 | -- | |
| -- | $12,000 | -- | |
| -- | -- | -- |
Source: Public Records
Mortgage History
| Date | Status | Borrower | Loan Amount |
|---|---|---|---|
| Previous Owner | Mckenley Willie | $85,285 |
Source: Public Records
Tax History
| Year | Tax Paid | Tax Assessment Tax Assessment Total Assessment is a certain percentage of the fair market value that is determined by local assessors to be the total taxable value of land and additions on the property. | Land | Improvement |
|---|---|---|---|---|
| 2025 | $1,589 | $58,280 | $2,800 | $55,480 |
| 2024 | $1,312 | $48,120 | $2,800 | $45,320 |
| 2023 | $1,210 | $44,360 | $2,800 | $41,560 |
| 2022 | $1,162 | $41,640 | $2,800 | $38,840 |
| 2021 | $972 | $32,240 | $2,800 | $29,440 |
| 2020 | $711 | $23,560 | $2,800 | $20,760 |
| 2019 | $653 | $21,640 | $2,800 | $18,840 |
| 2018 | $654 | $21,696 | $2,856 | $18,840 |
| 2017 | $654 | $21,696 | $2,856 | $18,840 |
| 2016 | $493 | $16,340 | $2,218 | $14,123 |
| 2015 | $576 | $21,039 | $2,856 | $18,183 |
| 2014 | $548 | $20,082 | $2,856 | $17,226 |
| 2013 | -- | $21,369 | $2,856 | $18,513 |
Source: Public Records
Map
Nearby Homes
- 202 Parker Ln
- 109 Garfield St
- 507 S Lee St
- 1520 Brownwood Ave
- 211 Moores Hill
- 0 Moores Hill
- 812 Elm St
- 1304 Forrest Ave
- 1405 Forrest Ave
- 1402 Forrest Ave
- 217 Jefferson St
- 0 N Lee St Unit 10550825
- 1015 Stonewall St
- 1017 Stonewall St
- 600 Park Ave
- 102 Crown St Unit LOT 1
- 101 Crown St Unit LOT 5
- 421 College Ave
- 1308 Forrest Ave
- 606 Poplar St
- 603 S Lee St
- 600 S Lee St
- 605 S Lee St
- 602 S Lee St
- 203 Jackson St
- 522 S Lee St
- 604 S Lee St
- 607 S Lee St Unit A
- 607 S Lee St Unit B
- 607 S Lee St
- 522 Jefferson St
- 520 S Lee St
- 606 S Lee St
- 520 Jefferson St Unit 11
- 520 Jefferson St
- 602 Jefferson St
- 609 S Lee St
- 600 Jefferson St
- 518 Jefferson St
- 604 Jefferson St
Your Personal Tour Guide
Ask me questions while you tour the home.