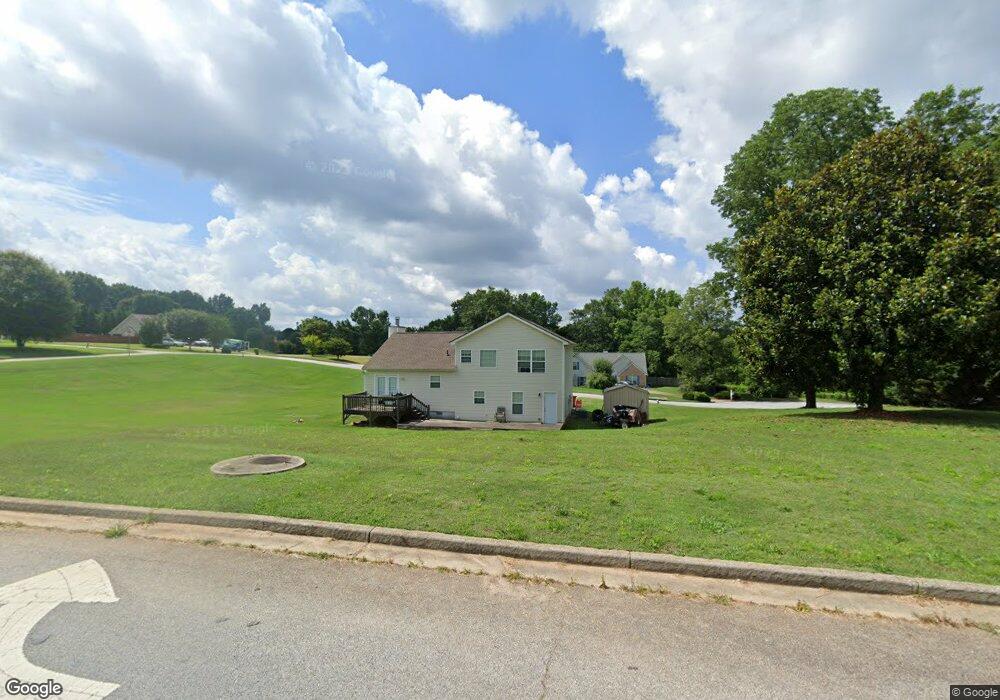
601 Skyland Ct Unit 39 Winder, GA 30680
Estimated Value: $300,000 - $347,000
4
Beds
3
Baths
1,745
Sq Ft
$187/Sq Ft
Est. Value
About This Home
This home is located at 601 Skyland Ct Unit 39, Winder, GA 30680 and is currently estimated at $325,738, approximately $186 per square foot. 601 Skyland Ct Unit 39 is a home located in Barrow County with nearby schools including Bethlehem Elementary School, Haymon-Morris Middle School, and Apalachee High School.
Ownership History
Date
Name
Owned For
Owner Type
Purchase Details
Closed on
Feb 11, 2013
Sold by
Rancho Investments Llc
Bought by
Yancy Melanie A
Current Estimated Value
Home Financials for this Owner
Home Financials are based on the most recent Mortgage that was taken out on this home.
Original Mortgage
$93,279
Outstanding Balance
$65,478
Interest Rate
3.5%
Mortgage Type
FHA
Estimated Equity
$260,260
Purchase Details
Closed on
Oct 2, 2012
Sold by
Cash Dale P
Bought by
Rancho Investments Llc
Purchase Details
Closed on
Feb 25, 2004
Sold by
Smith Mill Development Inc
Bought by
Southfork Homes Inc
Purchase Details
Closed on
Aug 20, 2002
Bought by
Smith Mill Development Inc
Create a Home Valuation Report for This Property
The Home Valuation Report is an in-depth analysis detailing your home's value as well as a comparison with similar homes in the area
Home Values in the Area
Average Home Value in this Area
Purchase History
| Date | Buyer | Sale Price | Title Company |
|---|---|---|---|
| Yancy Melanie A | $95,000 | -- | |
| Rancho Investments Llc | -- | -- | |
| Southfork Homes Inc | $35,000 | -- | |
| Smith Mill Development Inc | -- | -- |
Source: Public Records
Mortgage History
| Date | Status | Borrower | Loan Amount |
|---|---|---|---|
| Open | Yancy Melanie A | $93,279 |
Source: Public Records
Tax History Compared to Growth
Tax History
| Year | Tax Paid | Tax Assessment Tax Assessment Total Assessment is a certain percentage of the fair market value that is determined by local assessors to be the total taxable value of land and additions on the property. | Land | Improvement |
|---|---|---|---|---|
| 2024 | $2,188 | $89,032 | $16,000 | $73,032 |
| 2023 | $1,780 | $89,432 | $16,000 | $73,432 |
| 2022 | $1,836 | $64,791 | $16,000 | $48,791 |
| 2021 | $1,930 | $64,791 | $16,000 | $48,791 |
| 2020 | $1,926 | $64,791 | $16,000 | $48,791 |
| 2019 | $1,959 | $64,791 | $16,000 | $48,791 |
| 2018 | $1,618 | $54,495 | $12,000 | $42,495 |
| 2017 | $1,398 | $48,000 | $12,000 | $36,000 |
| 2016 | $1,304 | $45,124 | $12,000 | $33,124 |
| 2015 | $1,321 | $45,483 | $12,000 | $33,483 |
| 2014 | $1,101 | $40,801 | $6,958 | $33,843 |
| 2013 | -- | $39,128 | $6,958 | $32,170 |
Source: Public Records
Map
Nearby Homes