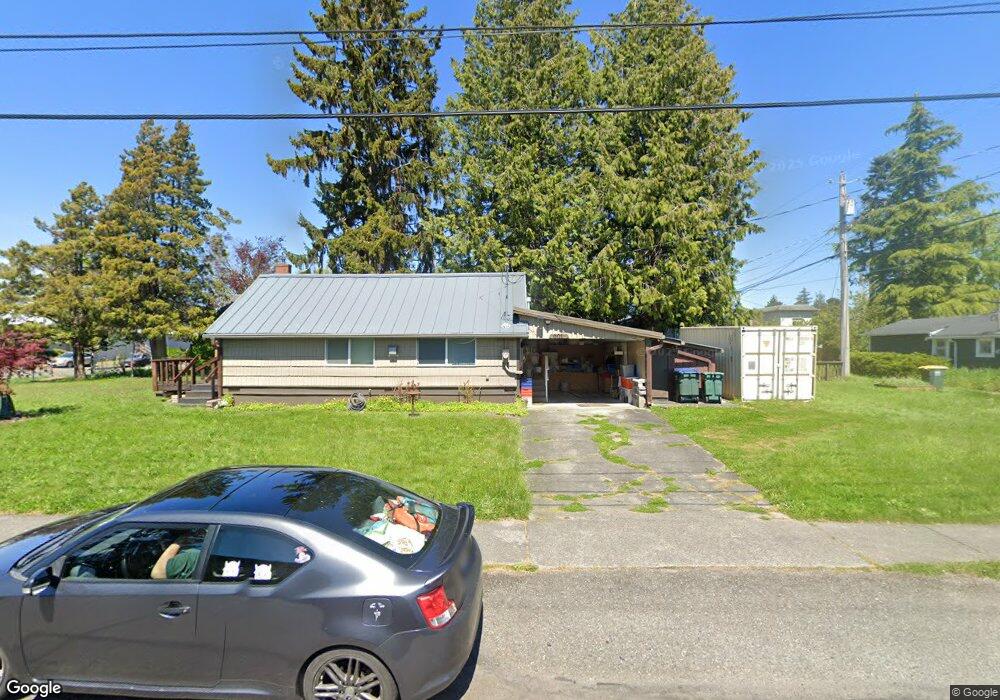
601 Virginia St Bellingham, WA 98225
Sunnyland NeighborhoodEstimated Value: $454,000 - $474,115
2
Beds
1
Bath
600
Sq Ft
$776/Sq Ft
Est. Value
About This Home
This home is located at 601 Virginia St, Bellingham, WA 98225 and is currently estimated at $465,779, approximately $776 per square foot. 601 Virginia St is a home located in Whatcom County with nearby schools including Sunnyland Elementary School, Whatcom Middle School, and Bellingham High School.
Ownership History
Date
Name
Owned For
Owner Type
Purchase Details
Closed on
Jan 28, 2020
Sold by
Lambke Tommie K and Lambke Bernice E
Bought by
Lambke Bernice E
Current Estimated Value
Purchase Details
Closed on
Oct 1, 2018
Sold by
Lambke Bernice E
Bought by
Lambke Bernice E and Lambke Family Trust
Purchase Details
Closed on
Aug 22, 2009
Sold by
Haehn John D
Bought by
Held Bernice E
Purchase Details
Closed on
Jun 30, 2009
Sold by
Held Bernice E
Bought by
Held Bernice E
Purchase Details
Closed on
Apr 19, 2005
Sold by
Held Bernice E and Haehn John D
Bought by
The Haehn Family Living Trust
Create a Home Valuation Report for This Property
The Home Valuation Report is an in-depth analysis detailing your home's value as well as a comparison with similar homes in the area
Home Values in the Area
Average Home Value in this Area
Purchase History
| Date | Buyer | Sale Price | Title Company |
|---|---|---|---|
| Lambke Bernice E | -- | None Available | |
| Lambke Bernice E | -- | None Available | |
| Held Bernice E | -- | None Available | |
| Held Bernice E | -- | None Available | |
| The Haehn Family Living Trust | -- | -- | |
| Haehn Bernice E | -- | -- |
Source: Public Records
Tax History Compared to Growth
Tax History
| Year | Tax Paid | Tax Assessment Tax Assessment Total Assessment is a certain percentage of the fair market value that is determined by local assessors to be the total taxable value of land and additions on the property. | Land | Improvement |
|---|---|---|---|---|
| 2024 | $3,281 | $410,906 | $246,304 | $164,602 |
| 2023 | $3,281 | $421,343 | $252,560 | $168,783 |
| 2022 | $2,678 | $363,233 | $217,728 | $145,505 |
| 2021 | $2,627 | $288,280 | $172,800 | $115,480 |
| 2020 | $2,544 | $266,926 | $160,000 | $106,926 |
| 2019 | $313 | $249,817 | $141,415 | $108,402 |
| 2018 | $332 | $224,259 | $126,965 | $97,294 |
| 2017 | $352 | $193,078 | $109,310 | $83,768 |
| 2016 | $350 | $173,821 | $98,090 | $75,731 |
| 2015 | $365 | $158,460 | $89,590 | $68,870 |
| 2014 | -- | $150,342 | $85,000 | $65,342 |
| 2013 | -- | $140,534 | $78,750 | $61,784 |
Source: Public Records
Map
Nearby Homes
- 2204 Humboldt St
- 615 Virginia St
- 2216 Humboldt St
- 2218 Humboldt St
- 2211 Iron St
- 617 Virginia St
- 612 Virginia St
- 2213 Iron St
- 2220 Humboldt St
- 2137 Iron St
- 2219 Iron St
- 2224 Humboldt St
- 2129 Iron St
- 2228 Humboldt St
- 2131 Humboldt St
- 2225 Iron St
- 2114 Humboldt St
- 2121 Iron St
- 2229 Iron St
- 2200 Iron St