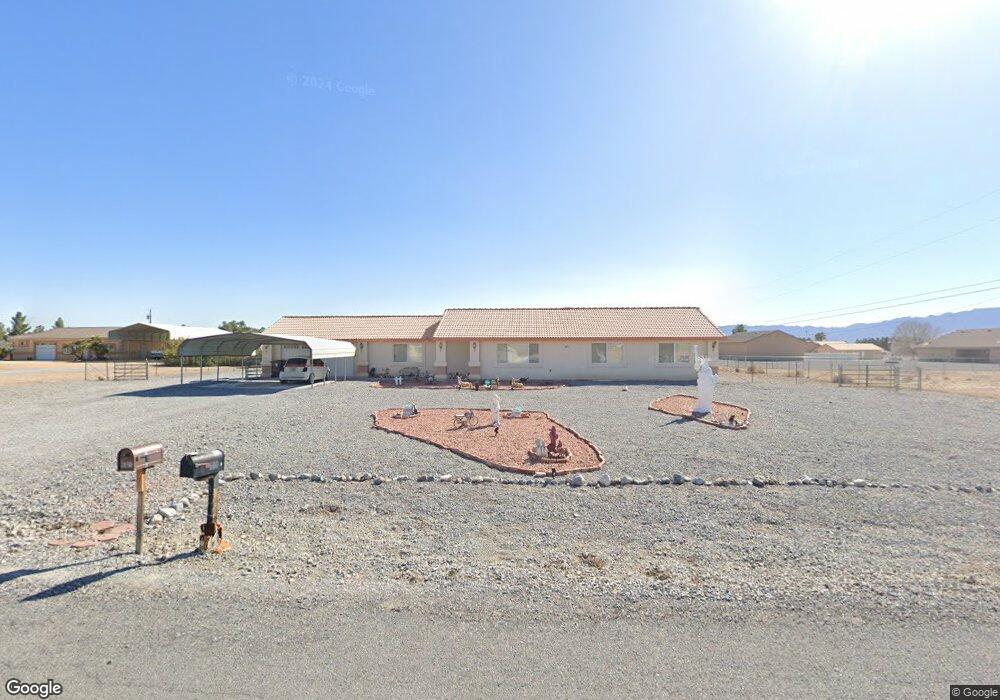
601 W Chipmunk Rd Pahrump, NV 89048
Estimated Value: $306,000 - $365,000
--
Bed
--
Bath
1,704
Sq Ft
$201/Sq Ft
Est. Value
About This Home
This home is located at 601 W Chipmunk Rd, Pahrump, NV 89048 and is currently estimated at $342,534, approximately $201 per square foot. 601 W Chipmunk Rd is a home located in Nye County with nearby schools including J.G. Johnson Elementary School, Rosemary Clarke Middle School, and Pahrump Valley High School.
Ownership History
Date
Name
Owned For
Owner Type
Purchase Details
Closed on
Dec 3, 2016
Sold by
Fullen Charles Louis and Weiland Sharon Lee
Bought by
Fullen Charles Louis and Weiland Sharon Lee
Current Estimated Value
Home Financials for this Owner
Home Financials are based on the most recent Mortgage that was taken out on this home.
Original Mortgage
$179,742
Outstanding Balance
$86,347
Interest Rate
3.47%
Mortgage Type
VA
Estimated Equity
$256,187
Purchase Details
Closed on
Dec 2, 2016
Sold by
Fullen Charles Louis and Weiland Sharon Lee
Bought by
Fullen Charles Louis and Weiland Sharon Lee
Home Financials for this Owner
Home Financials are based on the most recent Mortgage that was taken out on this home.
Original Mortgage
$179,742
Outstanding Balance
$86,347
Interest Rate
3.47%
Mortgage Type
VA
Estimated Equity
$256,187
Purchase Details
Closed on
Dec 7, 2006
Sold by
Weiland Sharon Lee
Bought by
The Weiland/Fullen Living Trust
Create a Home Valuation Report for This Property
The Home Valuation Report is an in-depth analysis detailing your home's value as well as a comparison with similar homes in the area
Home Values in the Area
Average Home Value in this Area
Purchase History
| Date | Buyer | Sale Price | Title Company |
|---|---|---|---|
| Fullen Charles Louis | -- | National Closing Solutions | |
| Fullen Charles Louis | -- | National Closing Solutions | |
| The Weiland/Fullen Living Trust | -- | None Available |
Source: Public Records
Mortgage History
| Date | Status | Borrower | Loan Amount |
|---|---|---|---|
| Open | Fullen Charles Louis | $179,742 |
Source: Public Records
Tax History Compared to Growth
Tax History
| Year | Tax Paid | Tax Assessment Tax Assessment Total Assessment is a certain percentage of the fair market value that is determined by local assessors to be the total taxable value of land and additions on the property. | Land | Improvement |
|---|---|---|---|---|
| 2025 | $1,092 | $62,425 | $4,135 | $58,290 |
| 2024 | $1,092 | $62,234 | $4,135 | $58,099 |
| 2023 | $1,092 | $58,336 | $4,135 | $54,201 |
| 2022 | $1,138 | $52,677 | $4,135 | $48,542 |
| 2021 | $1,109 | $50,497 | $3,308 | $47,189 |
| 2020 | $1,077 | $50,542 | $3,308 | $47,234 |
| 2019 | $1,046 | $59,685 | $3,308 | $56,377 |
| 2018 | $1,016 | $57,156 | $2,646 | $54,510 |
| 2017 | $988 | $46,050 | $2,646 | $43,404 |
| 2016 | $964 | $28,082 | $2,646 | $25,436 |
| 2015 | $962 | $26,084 | $2,646 | $23,438 |
| 2014 | $935 | $28,095 | $2,646 | $25,449 |
Source: Public Records
Map
Nearby Homes
- 540 Brady Ln
- 601 W Nevada Highway 372
- 561 W Nevada Highway 372
- 1431 Silver Peak Ave
- 541 W Nevada Highway 372
- 1500 Peacock Ave
- 1250 SW Comstock Cir
- 311 Ferndell St
- 1640 Silver Peak Ave
- 291 Greenwater St
- 290 Kite St
- 1141 Turquoise Ave
- 261 Ferndell St
- 301 Jobella Ln
- 261 Ellendale St
- 300 Copper Flats Dr
- 280 Liberty St
- 261 Duck Creek Rd
- 261 Kite St
- 271 W Liberty St
- 600 W Chipmunk Rd
- 571 W Chipmunk Rd
- 541 W Chipmunk Rd
- 1331 Red Rock Dr
- 570 W Chipmunk Rd
- 541 W Chipmunk Rd
- 660 W Chipmunk Rd
- 660 W Chipmunk Rd
- 1370 Curtis Ct
- 1361 Red Rock Dr
- 1400 Curtis Ct
- 1371 Curtis Ct
- 1300 Red Rock Dr
- 1330 Red Rock Dr
- 1200 Red Rock Dr
- 1430 Curtis Ct
- 1401 S Curtis Ct
- 1360 Red Rock Dr
- 1431 Curtis Ct
- 730 W Chipmunk Rd