Estimated Value: $53,000 - $173,000
3
Beds
1
Bath
1,605
Sq Ft
$56/Sq Ft
Est. Value
About This Home
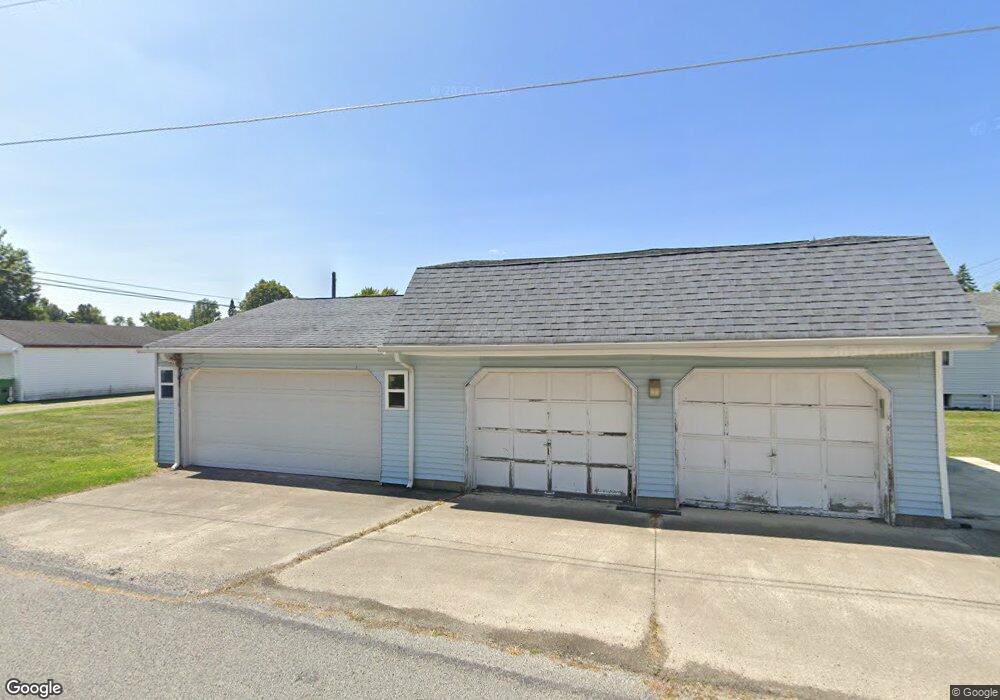
This home is located at 601 W Main St, Cairo, OH 45820 and is currently estimated at $89,297, approximately $55 per square foot. 601 W Main St is a home located in Allen County with nearby schools including Bath Elementary School, Bath Middle School, and Bath High School.
Ownership History
Date
Name
Owned For
Owner Type
Purchase Details
Closed on
Apr 3, 2015
Sold by
Chamberlin Tiffany
Bought by
Thompson Garrett and Thompson Heather Renee
Current Estimated Value
Purchase Details
Closed on
Mar 7, 2014
Sold by
Sneary Judy
Bought by
Chamberlin Tiffany
Purchase Details
Closed on
Feb 4, 2010
Sold by
Sneary Kenneth L
Bought by
Sneary Judy K
Purchase Details
Closed on
Jan 23, 2008
Sold by
Dnn Holding Llc
Bought by
Sneary Kenneth L and Sneary Judy K
Home Financials for this Owner
Home Financials are based on the most recent Mortgage that was taken out on this home.
Original Mortgage
$20,000
Interest Rate
6.17%
Mortgage Type
Purchase Money Mortgage
Purchase Details
Closed on
Oct 31, 2007
Sold by
Us Bank Na
Bought by
Dnn Holding Llc
Purchase Details
Closed on
Sep 26, 1990
Bought by
Wyatt Dennis Ray
Create a Home Valuation Report for This Property
The Home Valuation Report is an in-depth analysis detailing your home's value as well as a comparison with similar homes in the area
Purchase History
| Date | Buyer | Sale Price | Title Company |
|---|---|---|---|
| Thompson Garrett | $25,000 | None Available | |
| Chamberlin Tiffany | $28,000 | None Available | |
| Sneary Judy K | -- | Attorney | |
| Sneary Kenneth L | $25,000 | Attorney | |
| Dnn Holding Llc | $9,500 | None Available | |
| Wyatt Dennis Ray | $47,000 | -- |
Source: Public Records
Mortgage History
| Date | Status | Borrower | Loan Amount |
|---|---|---|---|
| Previous Owner | Sneary Kenneth L | $20,000 |
Source: Public Records
Tax History
| Year | Tax Paid | Tax Assessment Tax Assessment Total Assessment is a certain percentage of the fair market value that is determined by local assessors to be the total taxable value of land and additions on the property. | Land | Improvement |
|---|---|---|---|---|
| 2024 | $272 | $6,230 | $3,570 | $2,660 |
| 2023 | $369 | $4,410 | $2,520 | $1,890 |
| 2022 | $419 | $4,410 | $2,520 | $1,890 |
| 2021 | $456 | $4,410 | $2,520 | $1,890 |
| 2020 | $1,564 | $4,310 | $2,420 | $1,890 |
| 2019 | $1,564 | $12,500 | $2,420 | $10,080 |
| 2018 | $1,508 | $12,500 | $2,420 | $10,080 |
| 2017 | $1,470 | $10,820 | $2,420 | $8,400 |
| 2016 | $1,611 | $10,820 | $2,420 | $8,400 |
| 2015 | $933 | $10,820 | $2,420 | $8,400 |
| 2014 | $933 | $9,980 | $2,280 | $7,700 |
| 2013 | $517 | $9,980 | $2,280 | $7,700 |
Source: Public Records
Map
Nearby Homes
- 634 W Main St
- 513 W Main St
- 201 Wall St
- 102 W Main St
- 1085 Lutz Rd
- 4387 N West St
- 0 Fraunfelter Unit 307817
- 0 N Eastown Rd Unit 1034495
- 0 Thorndyke Dr
- 3137 Thorndyke Dr
- 3263 Shiloh Dr
- 475 Kenmore St
- 520 Kenmore St
- 2878 Autumn Lake Dr
- 2718 Carolyn Dr
- 8170 Sandy Point Rd
- 0 N Dixie Hwy Unit 300253
- 2630 Carolyn Dr
- 2380 Mandolin Dr
- 2371 Mandolin Dr
Your Personal Tour Guide
Ask me questions while you tour the home.