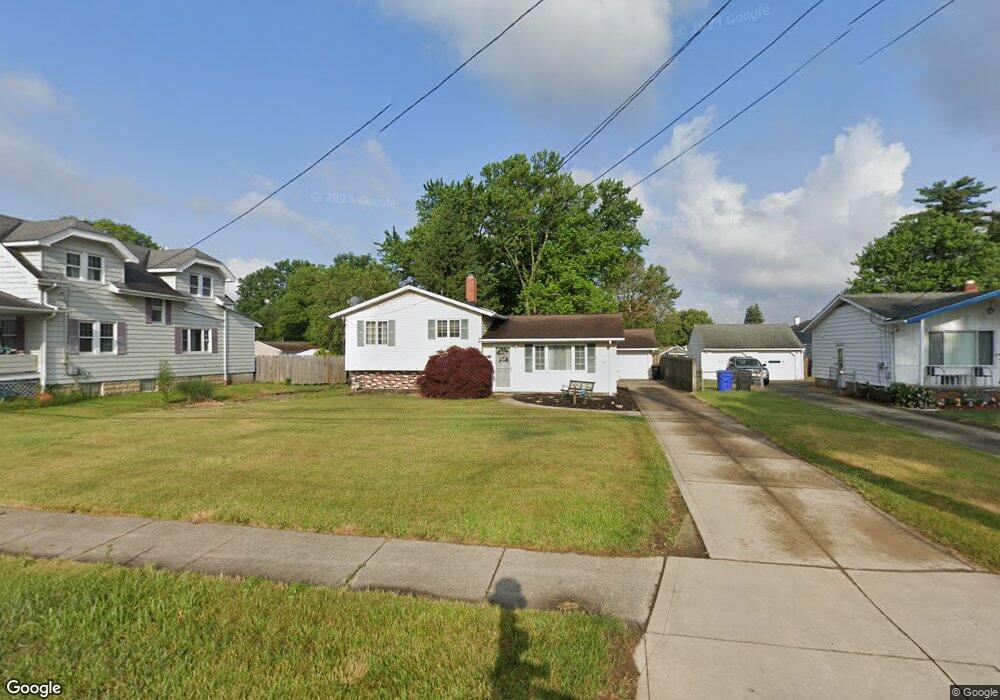
6010 W 130th St Brook Park, OH 44142
Estimated Value: $253,000 - $276,000
3
Beds
3
Baths
2,121
Sq Ft
$125/Sq Ft
Est. Value
About This Home
This home is located at 6010 W 130th St, Brook Park, OH 44142 and is currently estimated at $265,088, approximately $124 per square foot. 6010 W 130th St is a home located in Cuyahoga County with nearby schools including Berea-Midpark Middle School, Berea-Midpark High School, and Huber Heights Preparatory Academy Parma Academy.
Ownership History
Date
Name
Owned For
Owner Type
Purchase Details
Closed on
Aug 19, 2020
Sold by
Lewis Charles W and Lewis Trudy M
Bought by
Augenstein Jesse S and Augenstein Jennifer M
Current Estimated Value
Home Financials for this Owner
Home Financials are based on the most recent Mortgage that was taken out on this home.
Original Mortgage
$127,200
Outstanding Balance
$101,489
Interest Rate
2.9%
Mortgage Type
New Conventional
Estimated Equity
$163,599
Purchase Details
Closed on
Aug 26, 2009
Sold by
Drost James and Drost Sharon
Bought by
Augenstein Jennifer M and Lewis Charles W
Home Financials for this Owner
Home Financials are based on the most recent Mortgage that was taken out on this home.
Original Mortgage
$150,183
Interest Rate
5.21%
Mortgage Type
FHA
Purchase Details
Closed on
Aug 26, 1997
Sold by
O'Connor George V
Bought by
Tolbert Robert S and Tolbert Mary
Purchase Details
Closed on
Jan 24, 1997
Sold by
Maynard Margie
Bought by
O'Connor George and O'Connor Nymfa
Create a Home Valuation Report for This Property
The Home Valuation Report is an in-depth analysis detailing your home's value as well as a comparison with similar homes in the area
Home Values in the Area
Average Home Value in this Area
Purchase History
| Date | Buyer | Sale Price | Title Company |
|---|---|---|---|
| Augenstein Jesse S | -- | Title First Agency | |
| Augenstein Jennifer M | $153,000 | Maximum Title | |
| Tolbert Robert S | $145,000 | -- | |
| O'Connor George | $20,000 | -- |
Source: Public Records
Mortgage History
| Date | Status | Borrower | Loan Amount |
|---|---|---|---|
| Open | Augenstein Jesse S | $127,200 | |
| Previous Owner | Augenstein Jennifer M | $150,183 |
Source: Public Records
Tax History Compared to Growth
Tax History
| Year | Tax Paid | Tax Assessment Tax Assessment Total Assessment is a certain percentage of the fair market value that is determined by local assessors to be the total taxable value of land and additions on the property. | Land | Improvement |
|---|---|---|---|---|
| 2024 | $3,886 | $77,035 | $16,275 | $60,760 |
| 2023 | $3,996 | $65,600 | $15,440 | $50,160 |
| 2022 | $3,968 | $65,590 | $15,440 | $50,160 |
| 2021 | $3,944 | $65,590 | $15,440 | $50,160 |
| 2020 | $3,556 | $52,050 | $12,250 | $39,800 |
| 2019 | $3,450 | $148,700 | $35,000 | $113,700 |
| 2018 | $3,236 | $52,050 | $12,250 | $39,800 |
| 2017 | $3,289 | $46,030 | $10,330 | $35,700 |
| 2016 | $3,262 | $46,030 | $10,330 | $35,700 |
| 2015 | $2,915 | $46,030 | $10,330 | $35,700 |
| 2014 | $2,915 | $43,830 | $9,840 | $33,990 |
Source: Public Records
Map
Nearby Homes
- 13489 Havendale Dr
- 13602 Holland Rd
- 14055 Donald Dr
- 6274 Anita Dr
- 6321 W 130th St
- 6333 W 130th St
- 13971 Park Dr
- 6369 Anita Dr
- 14344 Fayette Blvd
- 13931 Franklyn Blvd
- 6212 Elmdale Rd
- 13879 Zaremba Dr
- 6413 Alexandria Dr
- 11914 Tucson Dr
- 5721 Michael Dr
- 6330 Michael Dr
- 6359 Middlebrook Blvd
- 6566 Elmdale Rd
- 13689 Pineview Ct
- 5882 Kings Hwy
- 6016 W 130th St
- 6004 W 130th St
- 5996 W 130th St
- 6020 W 130th St
- 6030 W 130th St
- 6127 W 130th St
- 13301 Heatherwood Dr
- 6133 W 130th St
- 13319 Heatherwood Dr
- 6141 W 130th St
- 6036 W 130th St
- 6042 W 130th St
- 6013 Havendale Dr
- 6005 Havendale Dr
- 6021 Havendale Dr
- 6029 Havendale Dr
- 5999 Havendale Dr
- 13351 Heatherwood Dr
- 13332 Heatherwood Dr
- 13364 Donald Dr