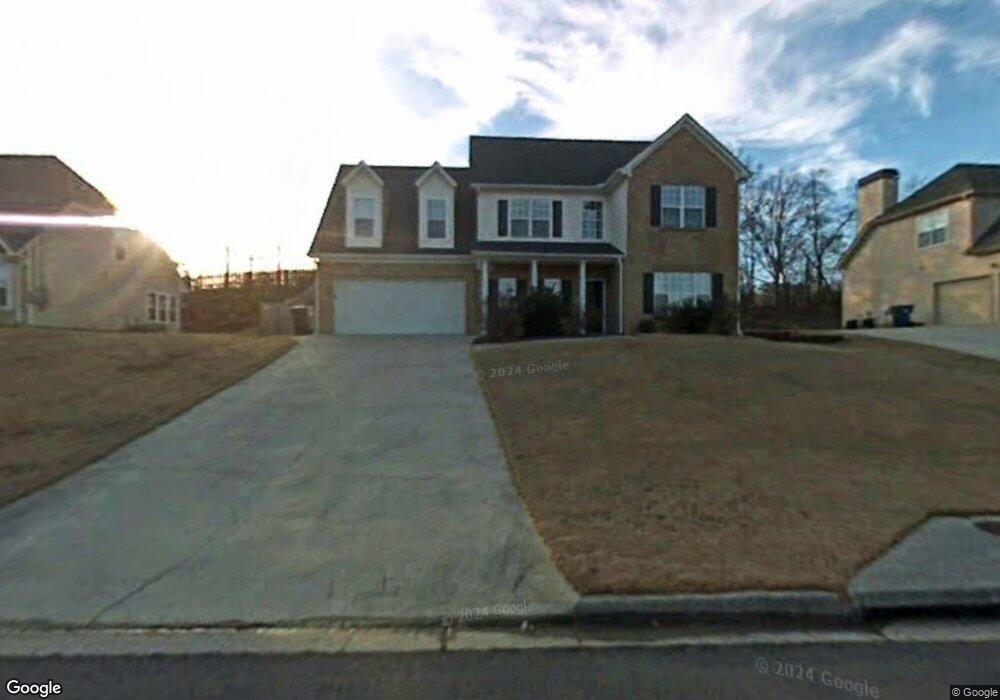
6010 W Rosie Ln SE Mableton, GA 30126
Estimated Value: $397,861 - $439,000
4
Beds
3
Baths
2,304
Sq Ft
$184/Sq Ft
Est. Value
About This Home
This home is located at 6010 W Rosie Ln SE, Mableton, GA 30126 and is currently estimated at $423,215, approximately $183 per square foot. 6010 W Rosie Ln SE is a home located in Cobb County with nearby schools including Clay-Harmony Leland Elementary School, Lindley Middle School, and Pebblebrook High School.
Ownership History
Date
Name
Owned For
Owner Type
Purchase Details
Closed on
Dec 19, 2018
Sold by
Powell Daniel J
Bought by
Powell Daniel J
Current Estimated Value
Home Financials for this Owner
Home Financials are based on the most recent Mortgage that was taken out on this home.
Original Mortgage
$153,496
Outstanding Balance
$97,767
Interest Rate
4.8%
Mortgage Type
New Conventional
Estimated Equity
$325,448
Purchase Details
Closed on
Oct 29, 2004
Sold by
Powell Daniel J
Bought by
Powell Daniel J and Powell Dorothy
Home Financials for this Owner
Home Financials are based on the most recent Mortgage that was taken out on this home.
Original Mortgage
$42,000
Interest Rate
5.65%
Mortgage Type
Unknown
Purchase Details
Closed on
May 29, 2002
Sold by
Benchmark Planners
Bought by
Mitchem Kalleah
Home Financials for this Owner
Home Financials are based on the most recent Mortgage that was taken out on this home.
Original Mortgage
$190,285
Interest Rate
6.85%
Mortgage Type
New Conventional
Create a Home Valuation Report for This Property
The Home Valuation Report is an in-depth analysis detailing your home's value as well as a comparison with similar homes in the area
Home Values in the Area
Average Home Value in this Area
Purchase History
| Date | Buyer | Sale Price | Title Company |
|---|---|---|---|
| Powell Daniel J | -- | -- | |
| Powell Daniel J | -- | -- | |
| Powell Daniel J | $210,000 | -- | |
| Cendant Mobility Financial Corp | $19,200 | -- | |
| Mitchem Kalleah | $200,300 | -- |
Source: Public Records
Mortgage History
| Date | Status | Borrower | Loan Amount |
|---|---|---|---|
| Open | Powell Daniel J | $153,496 | |
| Previous Owner | Cendant Mobility Financial Corp | $42,000 | |
| Previous Owner | Cendant Mobility Financial Corp | $42,000 | |
| Previous Owner | Cendant Mobility Financial Corp | $168,000 | |
| Previous Owner | Mitchem Kalleah | $190,285 |
Source: Public Records
Tax History Compared to Growth
Tax History
| Year | Tax Paid | Tax Assessment Tax Assessment Total Assessment is a certain percentage of the fair market value that is determined by local assessors to be the total taxable value of land and additions on the property. | Land | Improvement |
|---|---|---|---|---|
| 2024 | $4,081 | $174,240 | $36,000 | $138,240 |
| 2023 | $2,510 | $126,812 | $20,000 | $106,812 |
| 2022 | $3,076 | $126,812 | $20,000 | $106,812 |
| 2021 | $2,581 | $104,216 | $20,000 | $84,216 |
| 2020 | $2,581 | $104,216 | $20,000 | $84,216 |
| 2019 | $2,355 | $93,852 | $16,000 | $77,852 |
| 2018 | $2,148 | $84,420 | $16,000 | $68,420 |
| 2017 | $1,907 | $77,552 | $22,000 | $55,552 |
| 2016 | $1,736 | $69,720 | $18,000 | $51,720 |
| 2015 | $1,634 | $64,312 | $20,000 | $44,312 |
| 2014 | $1,648 | $64,312 | $0 | $0 |
Source: Public Records
Map
Nearby Homes
- 5977 Rosie Ln SE
- 5780 Schelton Place SE
- 5709 Registry Oaks Ln SE
- 5950 Community Rd SE
- 5705 Registry Oaks Ln SE
- 5724 Schelton Place SE
- 1049 Highland Village Trail
- 5708 Schelton Place SE
- 6141 Brookmere Place Unit 1
- 5696 Kilrush Ct SE
- 5621 Vinings Place Trail
- 6304 Brookwater View SE
- 1470 Riverline Ct SE
- 5560 Sylvania Dr SE
- 5724 Wandering Vine Trail SE
- 6014 W Rosie Ln SE
- 6008 W Rosie Ln SE Unit I
- 0 Rosie Ln SE Unit 7523438
- 0 Rosie Ln SE Unit 7359272
- 0 Rosie Ln SE Unit 8854970
- 0 Rosie Ln SE Unit 8792562
- 0 Rosie Ln SE Unit 8727067
- 0 Rosie Ln SE Unit 8732219
- 0 Rosie Ln SE Unit 8607962
- 0 Rosie Ln SE Unit 8481643
- 0 Rosie Ln SE Unit 8183010
- 0 Rosie Ln SE Unit 8130350
- 0 Rosie Ln SE Unit 8075828
- 0 Rosie Ln SE Unit 8051907
- 0 Rosie Ln SE Unit 8055008
- 0 Rosie Ln SE Unit 8034066
- 0 Rosie Ln SE Unit 8012009
- 0 Rosie Ln SE Unit 7439827
- 0 Rosie Ln SE Unit 8257128
- 0 Rosie Ln SE Unit 8025612