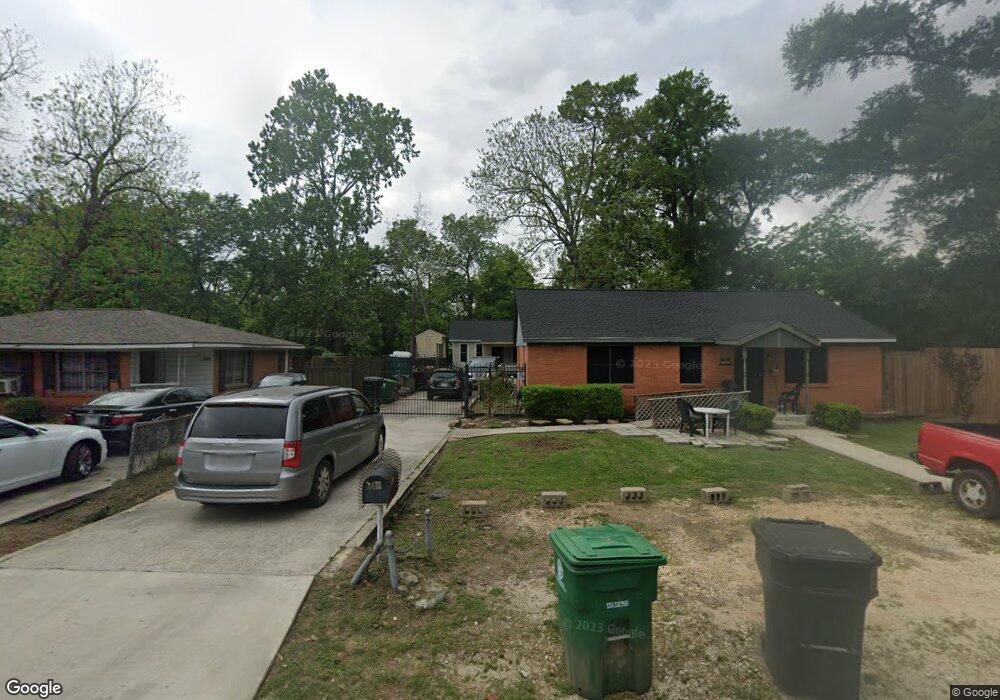
6011 Maxroy St Houston, TX 77091
Acres Homes NeighborhoodEstimated Value: $191,959 - $272,000
3
Beds
1
Bath
1,200
Sq Ft
$192/Sq Ft
Est. Value
About This Home
This home is located at 6011 Maxroy St, Houston, TX 77091 and is currently estimated at $230,990, approximately $192 per square foot. 6011 Maxroy St is a home located in Harris County with nearby schools including Reece Academy, Anderson Academy, and Drew Academy.
Ownership History
Date
Name
Owned For
Owner Type
Purchase Details
Closed on
Jul 11, 2016
Sold by
Elaine Green
Bought by
Curley Channea and Curley Curtis
Current Estimated Value
Home Financials for this Owner
Home Financials are based on the most recent Mortgage that was taken out on this home.
Original Mortgage
$13,500
Outstanding Balance
$10,718
Interest Rate
3.41%
Estimated Equity
$220,272
Purchase Details
Closed on
Apr 28, 2000
Sold by
Leonard Arbra
Bought by
Curley Bonita Hurd
Create a Home Valuation Report for This Property
The Home Valuation Report is an in-depth analysis detailing your home's value as well as a comparison with similar homes in the area
Home Values in the Area
Average Home Value in this Area
Purchase History
| Date | Buyer | Sale Price | Title Company |
|---|---|---|---|
| Curley Channea | -- | -- | |
| Curley Bonita Hurd | -- | -- |
Source: Public Records
Mortgage History
| Date | Status | Borrower | Loan Amount |
|---|---|---|---|
| Open | Curley Channea | $13,500 | |
| Closed | Curley Channea | -- |
Source: Public Records
Tax History Compared to Growth
Tax History
| Year | Tax Paid | Tax Assessment Tax Assessment Total Assessment is a certain percentage of the fair market value that is determined by local assessors to be the total taxable value of land and additions on the property. | Land | Improvement |
|---|---|---|---|---|
| 2025 | $1,111 | $213,545 | $102,231 | $111,314 |
| 2024 | $1,111 | $205,634 | $102,231 | $103,403 |
| 2023 | $1,111 | $200,276 | $94,796 | $105,480 |
| 2022 | $2,089 | $133,742 | $59,220 | $74,522 |
| 2021 | $1,989 | $79,168 | $24,675 | $54,493 |
| 2020 | $1,949 | $79,168 | $24,675 | $54,493 |
| 2019 | $1,858 | $79,168 | $24,675 | $54,493 |
| 2018 | $517 | $68,287 | $19,740 | $48,547 |
| 2017 | $1,472 | $68,287 | $19,740 | $48,547 |
| 2016 | $1,338 | $68,287 | $19,740 | $48,547 |
| 2015 | $906 | $45,852 | $12,338 | $33,514 |
| 2014 | $906 | $45,852 | $12,338 | $33,514 |
Source: Public Records
Map
Nearby Homes
- 1220 Highland Row Ln
- 1222 Highland Row Ln
- 1218 Highland Row Ln
- 1224 Highland Row Ln
- 1205 Highland Vineyard Ln
- 9363 Plan at Highland Commons
- 9263 Plan at Highland Commons
- 9272 Plan at Highland Commons
- 9269 Plan at Highland Commons
- 9264 Plan at Highland Commons
- 9381 Plan at Highland Commons
- 1321 De Soto St
- 1501 De Soto St Unit 6104
- 1501 De Soto St Unit 6130
- 1501 De Soto St Unit 6128
- 1226 Highland Row Ln
- 1213 De Soto St
- 6121 Pacific Forest Dr
- 6123 Pacific Forest Dr
- 6125 Pacific Forest Dr
- 6007 Maxroy St
- 6015 Maxroy St
- 5923 Maxroy St
- 6006 Maxroy St
- 5919 Maxroy St
- 6002 Maxroy St
- 00 De Soto St
- 5922 Maxroy St
- 1402 Mansfield St
- 5915 Maxroy St
- 5918 Maxroy St
- 1502 Armada Dr
- 5914 Maxroy St
- 5911 Maxroy St
- 1506 Armada Dr
- 000 De Soto St
- 1317 1/2 De Soto St
- 5910 Maxroy St
- 1400 Desoto
- 1317 De Soto St