Estimated Value: $338,000 - $392,000
--
Bed
2
Baths
2,049
Sq Ft
$180/Sq Ft
Est. Value
About This Home
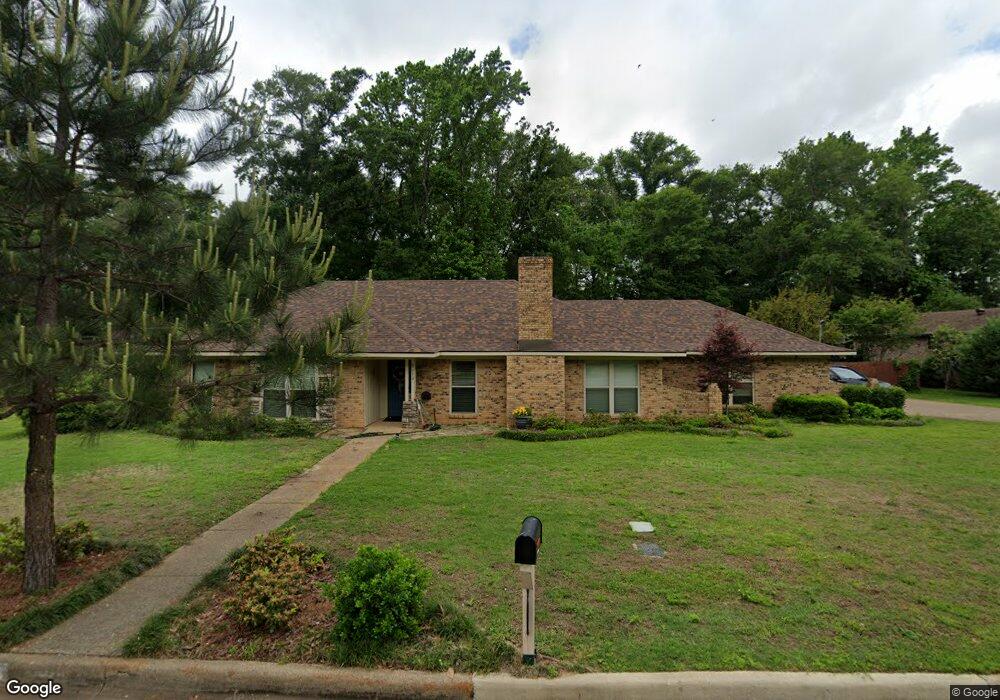
This home is located at 6013 Kingspark Dr, Tyler, TX 75703 and is currently estimated at $368,053, approximately $179 per square foot. 6013 Kingspark Dr is a home located in Smith County with nearby schools including Mozelle Brown Elementary School, J.W. Holloway Sixth Grade School, and Whitehouse High School.
Ownership History
Date
Name
Owned For
Owner Type
Purchase Details
Closed on
Feb 9, 2022
Sold by
Collin Mayo Robert
Bought by
Dudney Thomas David
Current Estimated Value
Home Financials for this Owner
Home Financials are based on the most recent Mortgage that was taken out on this home.
Original Mortgage
$288,000
Outstanding Balance
$266,442
Interest Rate
3.56%
Mortgage Type
New Conventional
Estimated Equity
$101,611
Purchase Details
Closed on
Jun 7, 2013
Sold by
Western Kirk and Western Becky
Bought by
Mayo Robert Collin and Mayo Hilary Jarman
Home Financials for this Owner
Home Financials are based on the most recent Mortgage that was taken out on this home.
Original Mortgage
$164,858
Interest Rate
3.25%
Mortgage Type
FHA
Create a Home Valuation Report for This Property
The Home Valuation Report is an in-depth analysis detailing your home's value as well as a comparison with similar homes in the area
Home Values in the Area
Average Home Value in this Area
Purchase History
| Date | Buyer | Sale Price | Title Company |
|---|---|---|---|
| Dudney Thomas David | -- | New Title Company Name | |
| Mayo Robert Collin | -- | None Available |
Source: Public Records
Mortgage History
| Date | Status | Borrower | Loan Amount |
|---|---|---|---|
| Open | Dudney Thomas David | $288,000 | |
| Previous Owner | Mayo Robert Collin | $164,858 |
Source: Public Records
Tax History Compared to Growth
Tax History
| Year | Tax Paid | Tax Assessment Tax Assessment Total Assessment is a certain percentage of the fair market value that is determined by local assessors to be the total taxable value of land and additions on the property. | Land | Improvement |
|---|---|---|---|---|
| 2025 | $4,029 | $339,275 | $121,879 | $217,396 |
| 2024 | $4,029 | $329,128 | $76,621 | $252,507 |
| 2023 | $4,963 | $325,983 | $76,621 | $249,362 |
| 2022 | $4,081 | $285,556 | $70,409 | $215,147 |
| 2021 | $3,974 | $212,698 | $41,055 | $171,643 |
| 2020 | $3,925 | $205,727 | $38,640 | $167,087 |
| 2019 | $3,688 | $184,895 | $24,150 | $160,745 |
| 2018 | $3,523 | $177,643 | $24,150 | $153,493 |
| 2017 | $3,115 | $177,695 | $24,150 | $153,545 |
| 2016 | $2,882 | $164,390 | $24,150 | $140,240 |
| 2015 | $2,438 | $158,844 | $24,150 | $134,694 |
| 2014 | $2,438 | $152,067 | $24,150 | $127,917 |
Source: Public Records
Map
Nearby Homes
- 5104 Kingspark Cir
- 5112 Timber Creek Dr
- 1401 Kidd Dr
- 5133 Avenham Ct
- 1021 Kingspark Dr
- 4805 Wendover Place
- 5117 Stagecoach Dr
- 1792 Stonecrest Blvd
- 5117 Stagecoach St
- 1707 Picadilly Place
- 5219 Stagecoach St
- 1507 Kensington Dr
- 1705 Devonshire Dr
- 1811 Picadilly Place
- 1137 Gardenwood Dr
- 1133 Gardenwood Dr
- 1173 Garden Park Cir
- 842 Ashford Ct
- 1103 Laurelwood Dr
- 1157 Garden Park Cir
- 5113 5113 Kingspark Cir
- 5101 Kingspark Dr
- 5028 Chad Dr
- 6012 6012 Kingspark Cir
- 6012 Kingspark Dr
- 6004 Kingspark Dr
- 5020 Chad Dr
- 5025 Kingspark Dr
- 5024 Kingspark Dr
- 5108 Chad Dr
- 5105 Timber Creek Dr
- 5101 Timber Creek Dr
- 5018 5018 Kingspark
- 5018 Kingspark Dr
- 5025 Timber Creek Dr
- 1308 Queenspark St
- 5112 Chad Dr
- 1309 Kingspark Dr
- 1406 1406 Kingspark Cir
- 5019 Timber Creek Dr