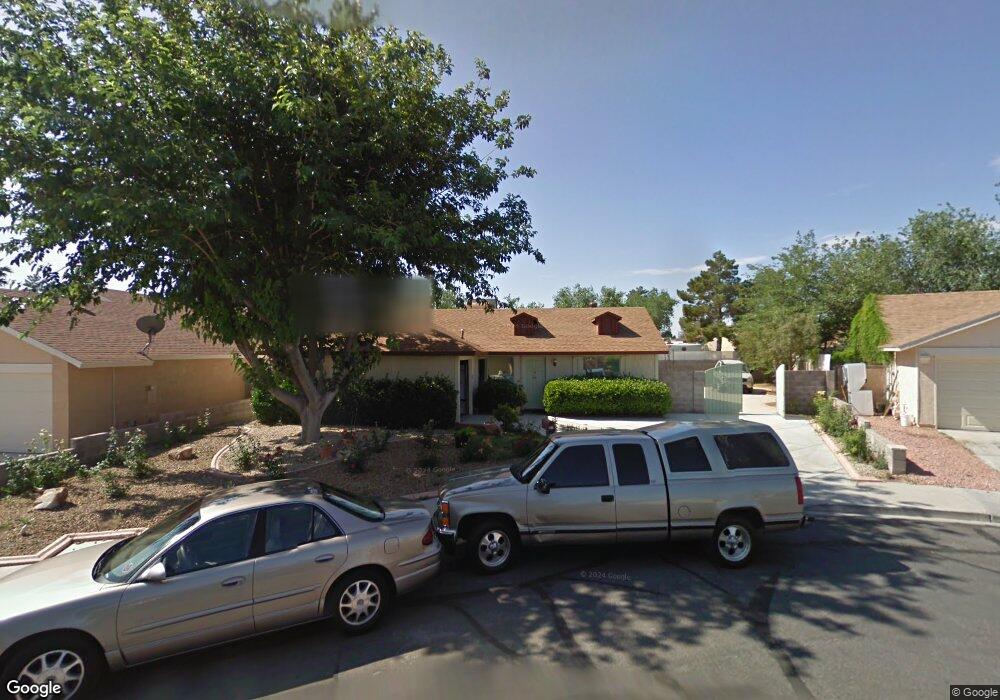
6013 Montecito Way Las Vegas, NV 89108
Woodcrest NeighborhoodEstimated Value: $361,338 - $405,000
3
Beds
2
Baths
1,208
Sq Ft
$324/Sq Ft
Est. Value
About This Home
This home is located at 6013 Montecito Way, Las Vegas, NV 89108 and is currently estimated at $390,835, approximately $323 per square foot. 6013 Montecito Way is a home located in Clark County with nearby schools including R.E. Tobler Elementary School, Irwin & Susan Molasky Junior High School, and Cheyenne High School.
Ownership History
Date
Name
Owned For
Owner Type
Purchase Details
Closed on
Feb 5, 2023
Sold by
Mejia Octavio
Bought by
Octavio Mejia And Luz Maria De Paz Revocable and Mejia
Current Estimated Value
Purchase Details
Closed on
Jan 20, 2012
Sold by
Quemuel Sally
Bought by
Mejia Octavio and Depaz Luz Maria
Home Financials for this Owner
Home Financials are based on the most recent Mortgage that was taken out on this home.
Original Mortgage
$60,428
Interest Rate
4.25%
Mortgage Type
FHA
Purchase Details
Closed on
Mar 8, 2006
Sold by
Quemuel Sally
Bought by
Quemuel Sally
Home Financials for this Owner
Home Financials are based on the most recent Mortgage that was taken out on this home.
Original Mortgage
$178,500
Interest Rate
6.19%
Mortgage Type
New Conventional
Create a Home Valuation Report for This Property
The Home Valuation Report is an in-depth analysis detailing your home's value as well as a comparison with similar homes in the area
Home Values in the Area
Average Home Value in this Area
Purchase History
| Date | Buyer | Sale Price | Title Company |
|---|---|---|---|
| Octavio Mejia And Luz Maria De Paz Revocable | $169,251 | None Listed On Document | |
| Mejia Octavio | $62,000 | National Title Company | |
| Quemuel Sally | -- | Fidelity National Title |
Source: Public Records
Mortgage History
| Date | Status | Borrower | Loan Amount |
|---|---|---|---|
| Previous Owner | Mejia Octavio | $60,428 | |
| Previous Owner | Quemuel Sally | $178,500 |
Source: Public Records
Tax History Compared to Growth
Tax History
| Year | Tax Paid | Tax Assessment Tax Assessment Total Assessment is a certain percentage of the fair market value that is determined by local assessors to be the total taxable value of land and additions on the property. | Land | Improvement |
|---|---|---|---|---|
| 2025 | $1,047 | $55,824 | $29,400 | $26,424 |
| 2024 | $1,017 | $55,824 | $29,400 | $26,424 |
| 2023 | $1,017 | $59,238 | $33,250 | $25,988 |
| 2022 | $988 | $50,098 | $25,900 | $24,198 |
| 2021 | $959 | $45,070 | $21,700 | $23,370 |
| 2020 | $928 | $43,831 | $20,300 | $23,531 |
| 2019 | $901 | $40,668 | $17,150 | $23,518 |
| 2018 | $875 | $38,023 | $15,050 | $22,973 |
| 2017 | $1,266 | $38,633 | $15,050 | $23,583 |
| 2016 | $830 | $32,592 | $8,400 | $24,192 |
| 2015 | $827 | $30,479 | $6,300 | $24,179 |
| 2014 | $803 | $24,412 | $6,300 | $18,112 |
Source: Public Records
Map
Nearby Homes
- 6000 Oceanside Way
- 6000 Santa Catalina Ave
- 0 Jone Unit 2603085
- 5901 Oceanside Way
- 5828 Divers Cove Way
- 3512 Corona Del Mar Dr
- 5801 Halfmoon Way
- 3501 Venice Dr
- 3601 Maverick St
- 6204 Barkstone Ave
- 3640 Fox Glen Pkwy
- 3265 Mustang St
- 3717 Snorkel Cir Unit C
- 3009 Brair Knoll Ct
- 3941 N Rancho Dr
- 3500 N Rancho Dr
- 6100 W Brooks Ave
- 3648 Glen Ridge Way
- 3605 N Torrey Pines Dr
- 2915 Maverick St
- 6009 Montecito Way
- 6012 Oceanside Way
- 6008 Oceanside Way
- 6016 Oceanside Way
- 6021 Montecito Way
- 6005 Montecito Way
- 6012 Montecito Way
- 6020 Montecito Way
- 6008 Montecito Way
- 6020 Oceanside Way
- 6016 W Monticeto Way
- 6016 Montecito Way
- 6001 Montecito Way
- 6004 Montecito Way
- 6021 Oceanside Way
- 6009 Oceanside Way
- 6013 Oceanside Way
- 6000 Montecito Way
- 5913 Montecito Way