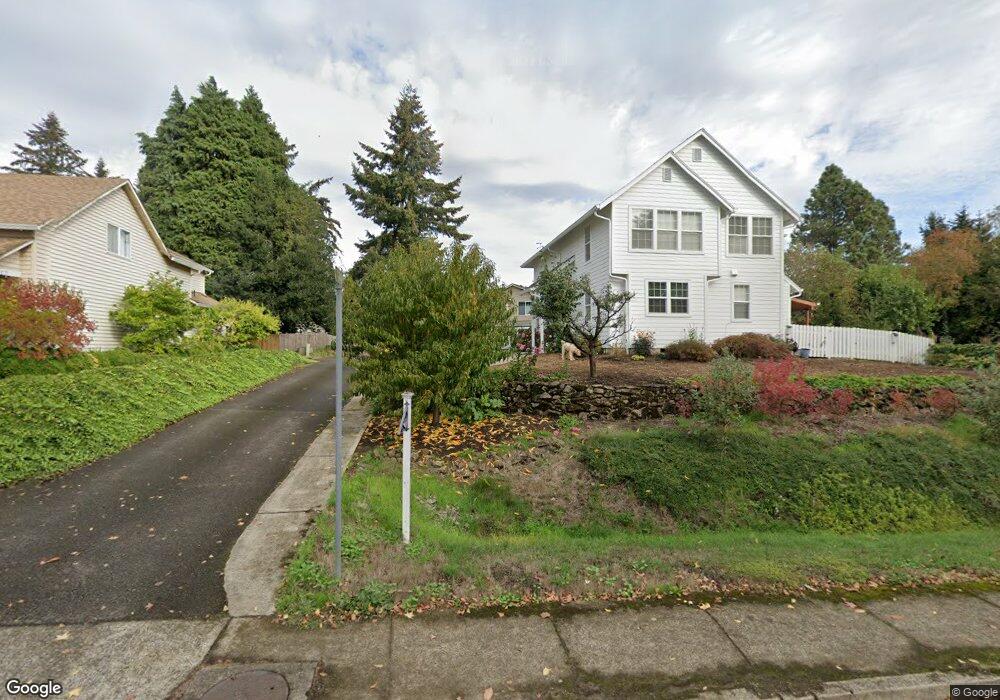
6013 NE 41st Ct Vancouver, WA 98661
Minnehaha NeighborhoodEstimated Value: $640,000 - $730,000
4
Beds
3
Baths
2,475
Sq Ft
$273/Sq Ft
Est. Value
About This Home
This home is located at 6013 NE 41st Ct, Vancouver, WA 98661 and is currently estimated at $674,882, approximately $272 per square foot. 6013 NE 41st Ct is a home located in Clark County with nearby schools including Minnehaha Elementary School, Jason Lee Middle School, and Hudson's Bay High School.
Ownership History
Date
Name
Owned For
Owner Type
Purchase Details
Closed on
Nov 5, 1997
Sold by
Crouse Martin and Crouse Emily E
Bought by
Allmain Scott and Allmain Heather
Current Estimated Value
Home Financials for this Owner
Home Financials are based on the most recent Mortgage that was taken out on this home.
Original Mortgage
$153,000
Outstanding Balance
$25,065
Interest Rate
7.26%
Estimated Equity
$649,817
Create a Home Valuation Report for This Property
The Home Valuation Report is an in-depth analysis detailing your home's value as well as a comparison with similar homes in the area
Home Values in the Area
Average Home Value in this Area
Purchase History
| Date | Buyer | Sale Price | Title Company |
|---|---|---|---|
| Allmain Scott | $170,000 | Transnation Title Insurance |
Source: Public Records
Mortgage History
| Date | Status | Borrower | Loan Amount |
|---|---|---|---|
| Open | Allmain Scott | $153,000 |
Source: Public Records
Tax History Compared to Growth
Tax History
| Year | Tax Paid | Tax Assessment Tax Assessment Total Assessment is a certain percentage of the fair market value that is determined by local assessors to be the total taxable value of land and additions on the property. | Land | Improvement |
|---|---|---|---|---|
| 2025 | $6,094 | $632,765 | $202,410 | $430,355 |
| 2024 | $5,667 | $614,954 | $202,410 | $412,544 |
| 2023 | $5,618 | $602,783 | $202,410 | $400,373 |
| 2022 | $5,286 | $597,740 | $202,410 | $395,330 |
| 2021 | $5,038 | $514,629 | $173,000 | $341,629 |
| 2020 | $4,391 | $460,253 | $140,000 | $320,253 |
| 2019 | $4,433 | $412,723 | $119,200 | $293,523 |
| 2018 | $4,682 | $433,815 | $0 | $0 |
| 2017 | $4,185 | $381,957 | $0 | $0 |
| 2016 | $3,941 | $359,626 | $0 | $0 |
| 2015 | $3,877 | $314,442 | $0 | $0 |
| 2014 | -- | $291,426 | $0 | $0 |
| 2013 | -- | $228,898 | $0 | $0 |
Source: Public Records
Map
Nearby Homes
- 4306 NE 61st St
- 6015 NE 44th Ave
- 3901 NE 57th St
- 6107 NE 45th Ct
- 5701 NE St Johns Rd Unit 11 ne
- 5701 NE St Johns Rd Unit 36
- 5701 NE St Johns Rd Unit 4
- 5701 NE St Johns Rd Unit 60
- 5701 NE St Johns Rd Unit 86
- 5701 NE St Johns Rd Unit 24
- 3602 NE 54th St
- 3001 NE 59th St
- 5302 NE 48th Ave
- 4819 NE 40th Ave
- Pearl Plan at Park Meadow at Walnut Grove
- Columbia Plan at Walnut Grove
- Columbia Plan at Park Meadow at Walnut Grove
- Henry Plan at Park Meadow at Walnut Grove
- Henry Plan at Walnut Grove
- Mercer Plan at Walnut Grove
- 6015 NE 40th Ave
- 4100 NE 60th St
- 4108 NE 60th St
- 6011 NE 41st Ct
- 6009 NE 40th Ave
- 4106 NE 60th St
- 3916 NE 60th St
- 4212 NE 60th St
- 3910 NE 60th St
- 4019 NE 60th St
- 5914 NE 41st Ave
- 4200 NE 60th St
- 4107 NE 60th St
- 5917 NE 42nd Ct
- 4115 NE 60th St
- 3915 NE 60th St
- 3904 NE 60th St
- 5913 NE 42nd Ct
- 5906 NE 41st Ave
- 3909 NE 60th St