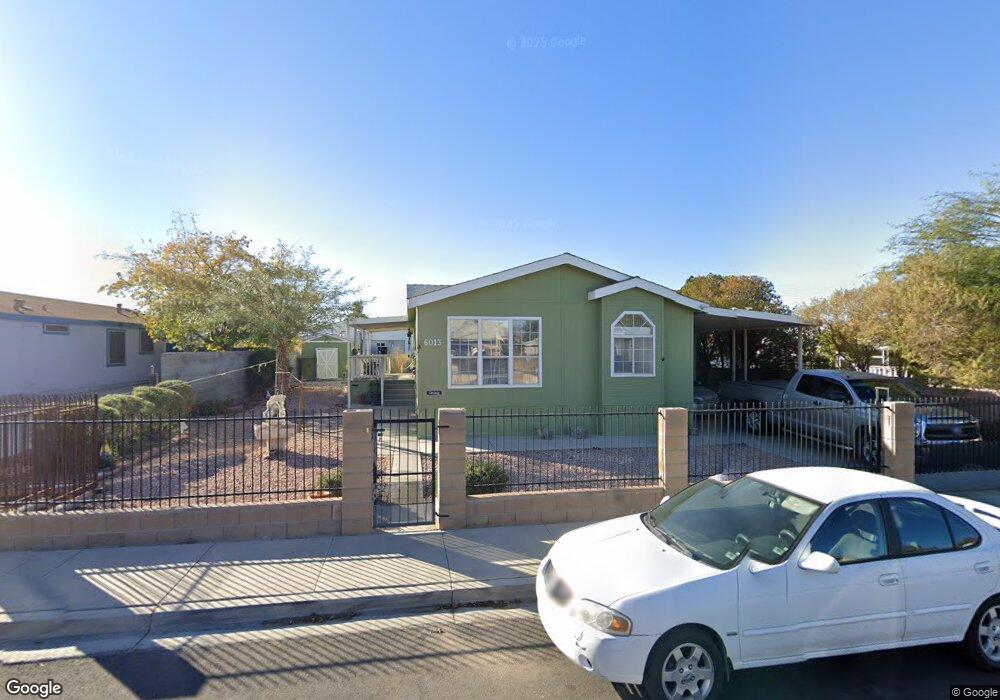
6013 Shenandoah Ave Las Vegas, NV 89156
Estimated Value: $246,753 - $334,000
3
Beds
2
Baths
1,722
Sq Ft
$174/Sq Ft
Est. Value
About This Home
This home is located at 6013 Shenandoah Ave, Las Vegas, NV 89156 and is currently estimated at $299,438, approximately $173 per square foot. 6013 Shenandoah Ave is a home located in Clark County with nearby schools including Helen Herr Elementary School, Dr. William H. Bailey Middle School, and Sunrise Mountain High School.
Ownership History
Date
Name
Owned For
Owner Type
Purchase Details
Closed on
Jul 30, 2007
Sold by
Hogan Joyce
Bought by
Hogan Joyce and Angelo Tammi
Current Estimated Value
Purchase Details
Closed on
Nov 7, 2005
Sold by
Cervantes Villalobos Leonel
Bought by
Hogan Joyce
Purchase Details
Closed on
Apr 7, 2003
Sold by
Webb George J and Webb Maureen Laronde
Bought by
Cervantes Villalobos Leonel
Home Financials for this Owner
Home Financials are based on the most recent Mortgage that was taken out on this home.
Original Mortgage
$108,202
Interest Rate
5.73%
Mortgage Type
FHA
Purchase Details
Closed on
Mar 4, 1999
Sold by
Crane Mahonri M
Bought by
Webb George J and Webb Maureen Laronde
Home Financials for this Owner
Home Financials are based on the most recent Mortgage that was taken out on this home.
Original Mortgage
$68,000
Interest Rate
6.73%
Create a Home Valuation Report for This Property
The Home Valuation Report is an in-depth analysis detailing your home's value as well as a comparison with similar homes in the area
Home Values in the Area
Average Home Value in this Area
Purchase History
| Date | Buyer | Sale Price | Title Company |
|---|---|---|---|
| Hogan Joyce | -- | None Available | |
| Hogan Joyce | $166,000 | Southwest Title | |
| Cervantes Villalobos Leonel | -- | Southwest Title | |
| Cervantes Villalobos Leonel | $109,900 | Pioneer National Title | |
| Webb George J | $80,000 | National Title Company |
Source: Public Records
Mortgage History
| Date | Status | Borrower | Loan Amount |
|---|---|---|---|
| Previous Owner | Cervantes Villalobos Leonel | $108,202 | |
| Previous Owner | Webb George J | $68,000 |
Source: Public Records
Tax History Compared to Growth
Tax History
| Year | Tax Paid | Tax Assessment Tax Assessment Total Assessment is a certain percentage of the fair market value that is determined by local assessors to be the total taxable value of land and additions on the property. | Land | Improvement |
|---|---|---|---|---|
| 2025 | $430 | $54,668 | $23,100 | $31,568 |
| 2024 | $418 | $54,668 | $23,100 | $31,568 |
| 2023 | $418 | $48,841 | $19,250 | $29,591 |
| 2022 | $406 | $42,890 | $15,400 | $27,490 |
| 2021 | $394 | $39,908 | $13,650 | $26,258 |
| 2020 | $380 | $38,148 | $12,250 | $25,898 |
| 2019 | $369 | $35,495 | $9,800 | $25,695 |
| 2018 | $358 | $31,543 | $6,650 | $24,893 |
| 2017 | $868 | $29,603 | $6,650 | $22,953 |
| 2016 | $340 | $21,000 | $6,300 | $14,700 |
| 2015 | $338 | $19,250 | $5,250 | $14,000 |
| 2014 | $328 | $11,781 | $5,250 | $6,531 |
Source: Public Records
Map
Nearby Homes
- 5994 Rocky Mountain Ave
- 5988 Castlemont Ave
- 2357 Flaming Gorge St
- 6071 Big Bend Ave
- 5987 Stone Hollow Ave
- 5822 E Carey Ave
- 2273 Toiyabe St
- 2257 Toiyabe St
- 2242 Toiyabe St
- 6012 Riflecrest Ave
- 6132 Stone Hollow Ave
- 6061 Judson Ave
- 6155 Bryce Canyon Ave
- 5988 Turtle River Ave
- 6080 E Great Smoky Ave
- 6271 E Great Smoky Ave
- 2248 Jo Anne Ln
- 2724 Echo Springs St
- 6266 Bluehurst Ave
- 2776 Jupiter Creek St
- 6003 Shenandoah Ave
- 6023 Shenandoah Ave
- 5993 Shenandoah Ave
- 6033 Shenandoah Ave
- 6024 Rocky Mountain Ave
- 6014 Shenandoah Ave
- 6004 Shenandoah Ave
- 6034 Rocky Mountain Ave
- 5984 Rocky Mountain Ave
- 6034 Shenandoah Ave
- 6044 Rocky Mountain Ave
- 2460 Toiyabe St
- 6044 Shenandoah Ave
- 6001 Rocky Mountain Ave
- 6005 Casa Loma Ave
- 6021 Rocky Mountain Ave
- 2470 Toiyabe St
- 6025 Casa Loma Ave
- 5995 Casa Loma Ave
- 5991 Rocky Mountain Ave