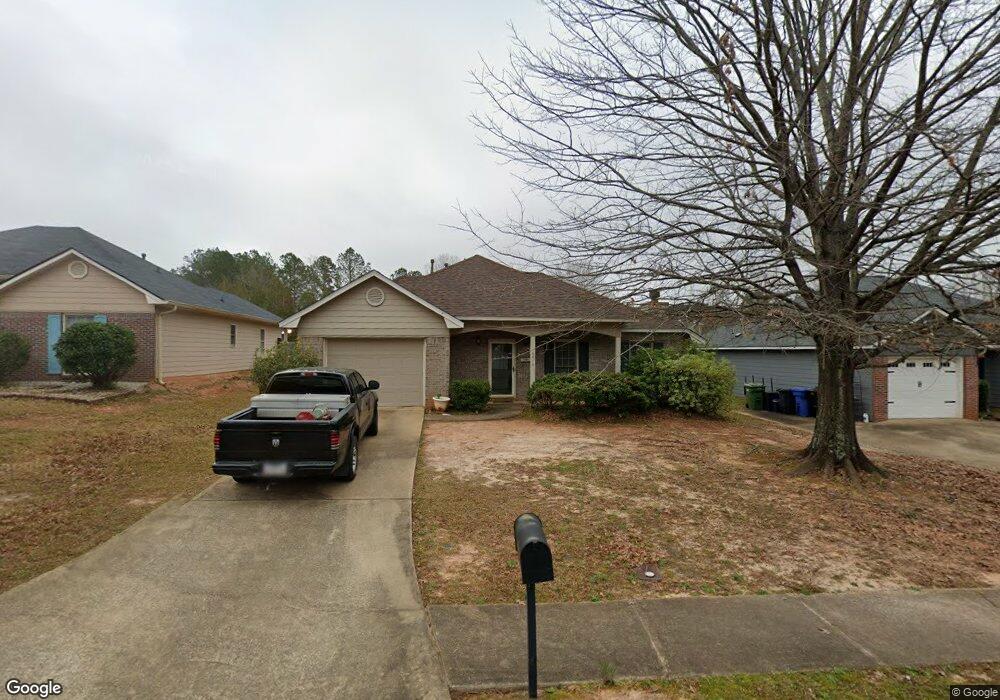
6016 N Pointe Dr Columbus, GA 31909
Estimated Value: $187,000 - $244,000
3
Beds
3
Baths
1,492
Sq Ft
$137/Sq Ft
Est. Value
About This Home
This home is located at 6016 N Pointe Dr, Columbus, GA 31909 and is currently estimated at $203,836, approximately $136 per square foot. 6016 N Pointe Dr is a home located in Muscogee County with nearby schools including Gentian Elementary School, Midland Middle School, and Hardaway High School.
Ownership History
Date
Name
Owned For
Owner Type
Purchase Details
Closed on
Feb 10, 2014
Sold by
Foley Antony O
Bought by
Broughton Catherine E
Current Estimated Value
Home Financials for this Owner
Home Financials are based on the most recent Mortgage that was taken out on this home.
Original Mortgage
$77,500
Outstanding Balance
$59,207
Interest Rate
4.55%
Mortgage Type
New Conventional
Estimated Equity
$134,965
Purchase Details
Closed on
Apr 27, 2009
Sold by
Broughton Catherine E
Bought by
Broughton Catherine E and Foley Anthony O
Purchase Details
Closed on
Apr 20, 2009
Sold by
Foley Anthony O
Bought by
Broughton Catherine E
Purchase Details
Closed on
Oct 23, 2008
Sold by
Pisiewski Catherine Broughton and Broughton Catherine E
Bought by
Foley Anthony O and Foley Elizabeth S
Purchase Details
Closed on
Jun 22, 2007
Sold by
Broughton Stephen Bernard
Bought by
Pisiewski Catherine Broughton
Create a Home Valuation Report for This Property
The Home Valuation Report is an in-depth analysis detailing your home's value as well as a comparison with similar homes in the area
Home Values in the Area
Average Home Value in this Area
Purchase History
| Date | Buyer | Sale Price | Title Company |
|---|---|---|---|
| Broughton Catherine E | -- | -- | |
| Shan Real Estate Llc | $127,500 | -- | |
| Broughton Catherine E | -- | None Available | |
| Broughton Catherine E | -- | None Available | |
| Broughton Catherine E | -- | None Available | |
| Foley Anthony O | -- | None Available | |
| Pisiewski Catherine Broughton | -- | None Available |
Source: Public Records
Mortgage History
| Date | Status | Borrower | Loan Amount |
|---|---|---|---|
| Open | Shan Real Estate Llc | $77,500 | |
| Closed | Shan Real Estate Llc | $77,500 | |
| Previous Owner | Pisiewski Catherine B | $126,800 | |
| Previous Owner | Pisiewski Catherine B | $9,500 |
Source: Public Records
Tax History Compared to Growth
Tax History
| Year | Tax Paid | Tax Assessment Tax Assessment Total Assessment is a certain percentage of the fair market value that is determined by local assessors to be the total taxable value of land and additions on the property. | Land | Improvement |
|---|---|---|---|---|
| 2025 | $2,647 | $67,620 | $9,788 | $57,832 |
| 2024 | $2,647 | $67,620 | $9,788 | $57,832 |
| 2023 | $2,664 | $67,620 | $9,788 | $57,832 |
| 2022 | $2,173 | $53,212 | $9,788 | $43,424 |
| 2021 | $1,986 | $48,632 | $9,788 | $38,844 |
| 2020 | $1,986 | $48,632 | $9,788 | $38,844 |
| 2019 | $1,993 | $48,632 | $9,788 | $38,844 |
| 2018 | $1,993 | $48,632 | $9,788 | $38,844 |
| 2017 | $1,999 | $48,632 | $9,788 | $38,844 |
| 2016 | $2,104 | $51,000 | $9,600 | $41,400 |
| 2015 | $2,106 | $51,000 | $9,600 | $41,400 |
| 2014 | $1,428 | $47,772 | $9,600 | $38,172 |
| 2013 | -- | $47,772 | $9,600 | $38,172 |
Source: Public Records
Map
Nearby Homes
- 5517 Rodgers Dr
- 5404 Moon Rd
- 3801 Austin Dr
- 4137 Yancy St
- 5829 Bush Ave
- 3710 Winkfield Place
- 5921 Lawson St
- 4627 Milgen Rd
- 3618 Grier Ave
- 4651 Milgen Rd
- 5866 Morningside Dr
- 5926 Frazier Dr
- 4036 Wilbur Dr
- 5521 Hodges Dr
- 5435 Wayne Dr
- 4847 Warm Springs Rd
- 5968 Saint Leonards Dr
- 4154 Will Rhoades Dr
- 4017 River Rock Way
- 5709 Hodges Dr
- 6012 N Pointe Dr
- 6020 N Pointe Dr
- 6008 N Pointe Dr
- 6024 N Pointe Dr
- 0 N Pointe Dr
- 6004 N Pointe Dr
- 6028 N Pointe Dr
- 6017 N Pointe Dr
- 6013 N Pointe Dr
- 6021 N Pointe Dr
- 6009 N Pointe Dr
- 6000 N Pointe Dr
- 6032 N Pointe Dr
- 6005 N Pointe Dr
- 6025 N Pointe Dr
- 6036 N Pointe Dr
- 6029 N Pointe Dr
- 5996 N Pointe Dr
- 6001 N Pointe Dr
- 4006 Pittman St