Estimated Value: $425,000 - $495,000
--
Bed
3
Baths
2,228
Sq Ft
$204/Sq Ft
Est. Value
About This Home
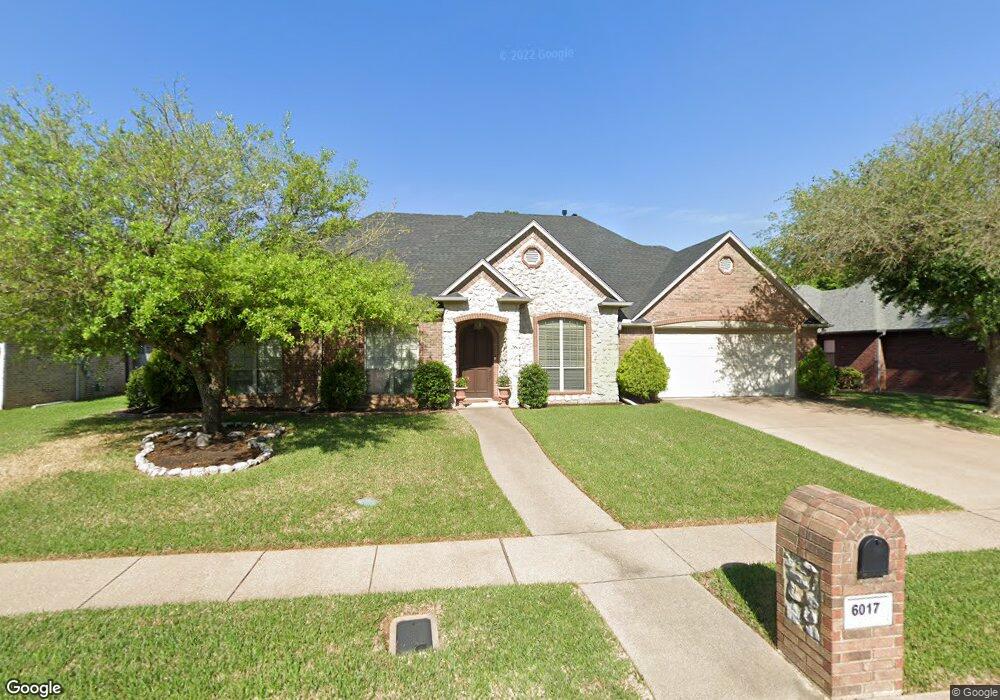
This home is located at 6017 Brynmar Ct, Tyler, TX 75703 and is currently estimated at $454,206, approximately $203 per square foot. 6017 Brynmar Ct is a home located in Smith County with nearby schools including Rice Elementary School, Hubbard Middle School, and Tyler Legacy High School.
Ownership History
Date
Name
Owned For
Owner Type
Purchase Details
Closed on
Sep 16, 2025
Sold by
Butcher Kate Lauren and Campbell Kate L
Bought by
Butcher Richard Bradley
Current Estimated Value
Purchase Details
Closed on
Aug 15, 2012
Sold by
Deshler Jonathan and Deshler Julia
Bought by
Butcher Richard B and Campbell Kate L
Home Financials for this Owner
Home Financials are based on the most recent Mortgage that was taken out on this home.
Original Mortgage
$257,743
Interest Rate
3.75%
Mortgage Type
FHA
Purchase Details
Closed on
Sep 19, 2008
Sold by
Buxton Todd C
Bought by
Deshler Jonathan
Home Financials for this Owner
Home Financials are based on the most recent Mortgage that was taken out on this home.
Original Mortgage
$208,800
Interest Rate
6.57%
Mortgage Type
Purchase Money Mortgage
Create a Home Valuation Report for This Property
The Home Valuation Report is an in-depth analysis detailing your home's value as well as a comparison with similar homes in the area
Home Values in the Area
Average Home Value in this Area
Purchase History
| Date | Buyer | Sale Price | Title Company |
|---|---|---|---|
| Butcher Richard Bradley | -- | None Listed On Document | |
| Butcher Richard B | -- | Ctc | |
| Deshler Jonathan | -- | None Available |
Source: Public Records
Mortgage History
| Date | Status | Borrower | Loan Amount |
|---|---|---|---|
| Previous Owner | Butcher Richard B | $257,743 | |
| Previous Owner | Deshler Jonathan | $208,800 |
Source: Public Records
Tax History Compared to Growth
Tax History
| Year | Tax Paid | Tax Assessment Tax Assessment Total Assessment is a certain percentage of the fair market value that is determined by local assessors to be the total taxable value of land and additions on the property. | Land | Improvement |
|---|---|---|---|---|
| 2025 | $6,422 | $424,365 | $44,617 | $379,748 |
| 2024 | $6,422 | $437,298 | $61,250 | $384,459 |
| 2023 | $6,930 | $403,013 | $61,250 | $341,763 |
| 2022 | $7,080 | $361,404 | $48,300 | $313,104 |
| 2021 | $7,131 | $339,883 | $48,300 | $291,583 |
| 2020 | $7,221 | $337,447 | $48,300 | $289,147 |
| 2019 | $6,790 | $310,498 | $35,000 | $275,498 |
| 2018 | $6,200 | $285,050 | $35,000 | $250,050 |
| 2017 | $6,137 | $287,435 | $35,000 | $252,435 |
| 2016 | $6,102 | $285,796 | $35,000 | $250,796 |
| 2015 | $5,423 | $276,192 | $35,000 | $241,192 |
| 2014 | $5,423 | $267,682 | $35,000 | $232,682 |
Source: Public Records
Map
Nearby Homes
- 5829 Brynmar Ct
- 1869 Hollylake Cir
- 5900 Stoneleigh Dr
- 1915 Hollyglen Dr
- 5803 Stoneleigh Dr
- 5701 Plantation Dr
- 5821 Cross Creek Cir
- 940 La Vista Dr
- 1212 Parkview Dr
- 954 La Vista Dr
- 973 Creekside Dr
- 5290 Tyler Park Dr
- 1601 Brandywine Dr
- 6309 Gleneagles Dr
- 716 Chimney Rock Dr
- 1710 Brandywine Dr
- 1706 Brandywine Dr
- 6001 Huntington Dr
- 5401 Hollytree Dr
- 5401 Hollytree Dr Unit 1002
- 6013 Brynmar Ct
- 6021 Brynmar Ct
- 1608 Brynmar Cir
- 6012 Brynmar Ct
- 6016 Brynmar Ct
- 6009 6009 Brynmar Ct
- 6008 Brynmar Ct
- 6008 6008 Brynmar Ct
- 6009 Brynmar Ct
- 6020 Brynmar Ct
- 1612 1612 Brynmar Cir
- 1612 Brynmar Cir
- 6005 6005 Brynmar Ct
- 6005 Brynmar Ct
- 5913 5913 Brynmar Ct
- 5909 5909 Brynmar Ct
- 6025 Brynmar Ct
- 5909 Brynmar Ct
- 5917 Brynmar Ct
- 1607 1607 Brynmar Cir