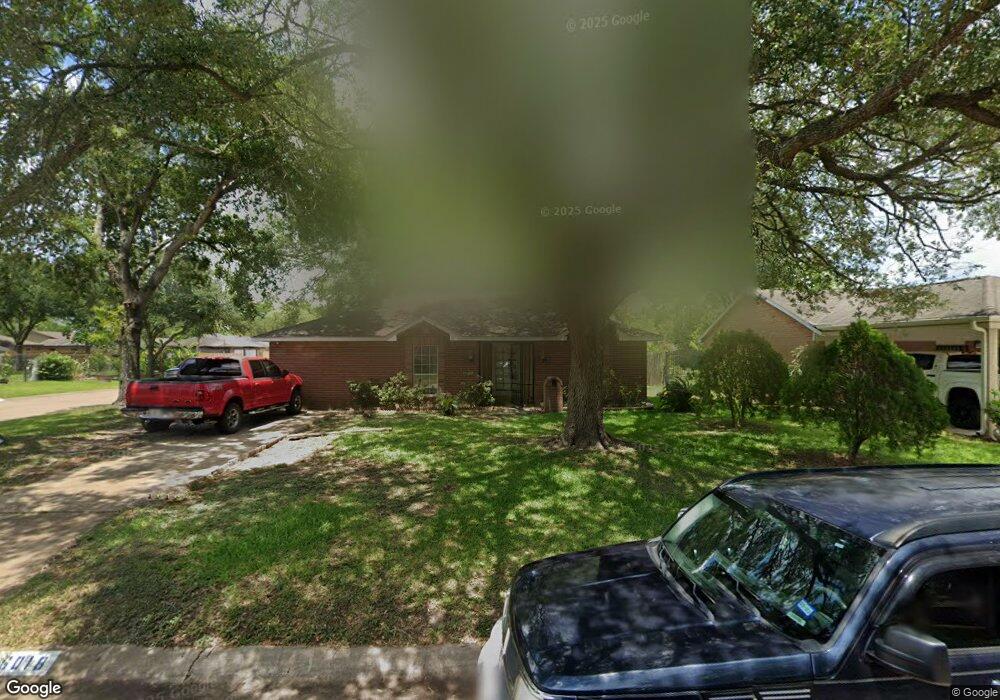
6018 Maywood Dr Houston, TX 77053
Fort Bend Houston NeighborhoodEstimated Value: $178,341 - $623,000
3
Beds
2
Baths
1,102
Sq Ft
$278/Sq Ft
Est. Value
About This Home
This home is located at 6018 Maywood Dr, Houston, TX 77053 and is currently estimated at $306,585, approximately $278 per square foot. 6018 Maywood Dr is a home located in Fort Bend County with nearby schools including Ridgegate Elementary School, Christa McAuliffe Middle School, and Willowridge High School.
Ownership History
Date
Name
Owned For
Owner Type
Purchase Details
Closed on
Aug 4, 2006
Sold by
Drummer Loretta L
Bought by
Barrera Luis
Current Estimated Value
Home Financials for this Owner
Home Financials are based on the most recent Mortgage that was taken out on this home.
Original Mortgage
$84,455
Outstanding Balance
$58,578
Interest Rate
9.84%
Mortgage Type
New Conventional
Estimated Equity
$248,007
Purchase Details
Closed on
Oct 15, 1999
Sold by
Listi Ursula Marta
Bought by
Barrera Luis
Home Financials for this Owner
Home Financials are based on the most recent Mortgage that was taken out on this home.
Original Mortgage
$55,657
Interest Rate
5.53%
Mortgage Type
FHA
Purchase Details
Closed on
Oct 7, 1999
Sold by
Listi Ursula M
Bought by
Drummer Loretta L
Home Financials for this Owner
Home Financials are based on the most recent Mortgage that was taken out on this home.
Original Mortgage
$55,657
Interest Rate
5.53%
Mortgage Type
FHA
Create a Home Valuation Report for This Property
The Home Valuation Report is an in-depth analysis detailing your home's value as well as a comparison with similar homes in the area
Home Values in the Area
Average Home Value in this Area
Purchase History
| Date | Buyer | Sale Price | Title Company |
|---|---|---|---|
| Barrera Luis | -- | Fidelity National Title | |
| Barrera Luis | -- | -- | |
| Drummer Loretta L | -- | Chicago Title |
Source: Public Records
Mortgage History
| Date | Status | Borrower | Loan Amount |
|---|---|---|---|
| Open | Barrera Luis | $84,455 | |
| Previous Owner | Drummer Loretta L | $55,657 | |
| Closed | Drummer Loretta L | $3,000 |
Source: Public Records
Tax History Compared to Growth
Tax History
| Year | Tax Paid | Tax Assessment Tax Assessment Total Assessment is a certain percentage of the fair market value that is determined by local assessors to be the total taxable value of land and additions on the property. | Land | Improvement |
|---|---|---|---|---|
| 2025 | $3,431 | $167,096 | $24,570 | $142,526 |
| 2024 | $3,431 | $177,967 | $24,570 | $153,397 |
| 2023 | $3,443 | $176,804 | $18,900 | $157,904 |
| 2022 | $2,991 | $141,130 | $18,900 | $122,230 |
| 2021 | $2,774 | $125,290 | $18,900 | $106,390 |
| 2020 | $2,655 | $117,730 | $18,900 | $98,830 |
| 2019 | $2,083 | $87,810 | $15,750 | $72,060 |
| 2018 | $2,035 | $85,730 | $15,750 | $69,980 |
| 2017 | $1,860 | $77,500 | $15,750 | $61,750 |
| 2016 | $1,725 | $71,860 | $15,750 | $56,110 |
| 2015 | $1,321 | $72,320 | $15,750 | $56,570 |
| 2014 | $1,094 | $59,610 | $15,750 | $43,860 |
Source: Public Records
Map
Nearby Homes
- 6101 Maywood Dr
- 15318 Corsair Rd
- 5734 Arthington St
- 15806 Corsair Rd
- 5605 Melanite Ave
- 5710 W Ridgecreek Dr
- 15610 Briar Spring Ct
- 15903 Lenclaire Dr
- 15734 Briargate Ct
- 5774 Gineridge Dr
- 5614 Condon Ln
- 15915 Dante Dr
- 15615 Raven Trail
- 0 Brooklawn Dr Unit 98139376
- 5418 Arthington St
- 15770 Chimney Rock Rd
- 5619 Gineridge Dr
- 6018 Beaconridge Dr
- 16210 Rosenridge Dr
- 15406 Markwood Ct
- 6014 Maywood Dr
- 6010 Maywood Dr
- 6102 Maywood Dr
- 6017 Arthington St
- 6013 Arthington St
- 6009 Arthington St
- 6006 Maywood Dr
- 6101 Arthington St
- 6013 Maywood Dr
- 6017 Maywood Dr
- 6009 Maywood Dr
- 6005 Arthington St
- 6105 Arthington St
- 6005 Maywood Dr
- 5918 Maywood Dr
- 6105 Maywood Dr
- 6114 Maywood Dr
- 6001 Arthington St
- 6001 Maywood Dr
- 6109 Maywood Dr