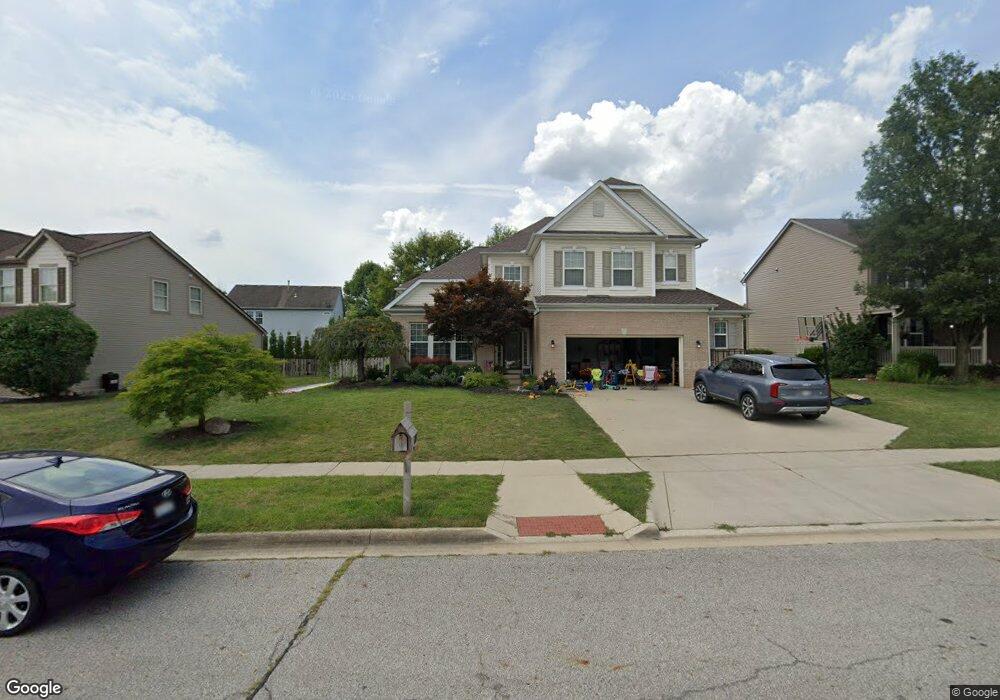
6019 Goldstone Dr Unit GR117 Grove City, OH 43123
Estimated Value: $520,010 - $554,000
4
Beds
5
Baths
3,100
Sq Ft
$172/Sq Ft
Est. Value
About This Home
This home is located at 6019 Goldstone Dr Unit GR117, Grove City, OH 43123 and is currently estimated at $534,253, approximately $172 per square foot. 6019 Goldstone Dr Unit GR117 is a home located in Franklin County with nearby schools including Buckeye Woods Elementary School, Hayes Intermediate School, and Jackson Middle School.
Ownership History
Date
Name
Owned For
Owner Type
Purchase Details
Closed on
Aug 31, 2021
Sold by
Schreck Clinton L and Schreck Teresa L
Bought by
Snyder Dustin Harold and Snyder Abbe
Current Estimated Value
Home Financials for this Owner
Home Financials are based on the most recent Mortgage that was taken out on this home.
Original Mortgage
$455,235
Outstanding Balance
$413,612
Interest Rate
2.7%
Mortgage Type
VA
Estimated Equity
$120,641
Purchase Details
Closed on
Jul 18, 2012
Sold by
Gorby Linda L
Bought by
Schreck Clinton L and Schreck Teresa L
Home Financials for this Owner
Home Financials are based on the most recent Mortgage that was taken out on this home.
Original Mortgage
$269,184
Interest Rate
3.65%
Mortgage Type
New Conventional
Purchase Details
Closed on
Feb 5, 2008
Sold by
Beazer Homes Investments Llc
Bought by
Gorby Larry A and Gorby Linda L
Purchase Details
Closed on
Sep 20, 2006
Sold by
Cross/Joshua Llc
Bought by
Beazer Homes Investments Llc
Create a Home Valuation Report for This Property
The Home Valuation Report is an in-depth analysis detailing your home's value as well as a comparison with similar homes in the area
Home Values in the Area
Average Home Value in this Area
Purchase History
| Date | Buyer | Sale Price | Title Company |
|---|---|---|---|
| Snyder Dustin Harold | $445,000 | First Ohio Ttl Ins Agcy Ltd | |
| Schreck Clinton L | $279,000 | None Available | |
| Gorby Larry A | $260,000 | Preferred T | |
| Beazer Homes Investments Llc | -- | Prefered |
Source: Public Records
Mortgage History
| Date | Status | Borrower | Loan Amount |
|---|---|---|---|
| Open | Snyder Dustin Harold | $455,235 | |
| Closed | Schreck Clinton L | $269,184 |
Source: Public Records
Tax History Compared to Growth
Tax History
| Year | Tax Paid | Tax Assessment Tax Assessment Total Assessment is a certain percentage of the fair market value that is determined by local assessors to be the total taxable value of land and additions on the property. | Land | Improvement |
|---|---|---|---|---|
| 2024 | $7,148 | $157,190 | $34,790 | $122,400 |
| 2023 | $7,047 | $157,185 | $34,790 | $122,395 |
| 2022 | $7,631 | $125,130 | $13,790 | $111,340 |
| 2021 | $7,778 | $125,130 | $13,790 | $111,340 |
| 2020 | $7,753 | $125,130 | $13,790 | $111,340 |
| 2019 | $6,966 | $104,300 | $11,480 | $92,820 |
| 2018 | $6,585 | $104,300 | $11,480 | $92,820 |
| 2017 | $6,571 | $104,300 | $11,480 | $92,820 |
| 2016 | $6,228 | $85,930 | $13,340 | $72,590 |
| 2015 | $6,230 | $85,930 | $13,340 | $72,590 |
| 2014 | $6,235 | $85,930 | $13,340 | $72,590 |
| 2013 | $2,802 | $81,830 | $12,705 | $69,125 |
Source: Public Records
Map
Nearby Homes
- 5971 Wynnewood Dr
- 1390 Hemetite Dr
- 5976 Sweet Basil Ln
- 5990 Sweet Basil Ln
- 5828 Wynnewood Dr
- 6092 Winnebago St
- 6229 Brookmeade Cir
- 6075 Sweet Basil Ln
- 6032 Sweet Basil Ln
- 6259 Rising Sun Dr
- 0 Borror Rd Unit 225023962
- 6295 Rising Sun Dr
- 1657 Ainwick Bend Unit A
- 1571 Cree Ct
- 1645 Withers Grove Loop
- 6014 Willow Aster Glen
- 5793 Daffodil Ct
- 6132 Windcliff Dr E
- 1669 Bookfield Ln
- 1675 Bookfield Ln
- 6019 Goldstone Dr
- 6009 Goldstone Dr
- 6029 Goldstone Ct
- 6029 Goldstone Dr
- 0 Platinum Dr
- 6028 Platinum Dr
- 6018 Platinum Dr
- 6038 Platinum Dr
- 5999 Goldstone Dr
- 6024 Goldstone Dr
- 5998 Platinum Dr
- 6004 Goldstone Dr
- 6034 Goldstone Dr
- 5989 Goldstone Dr
- 5988 Platinum Dr
- 5994 Goldstone Dr
- 6129 Buckeye Pkwy
- 1483 Hemetite Dr
- 6119 Buckeye Pkwy
- 6023 Platinum Dr