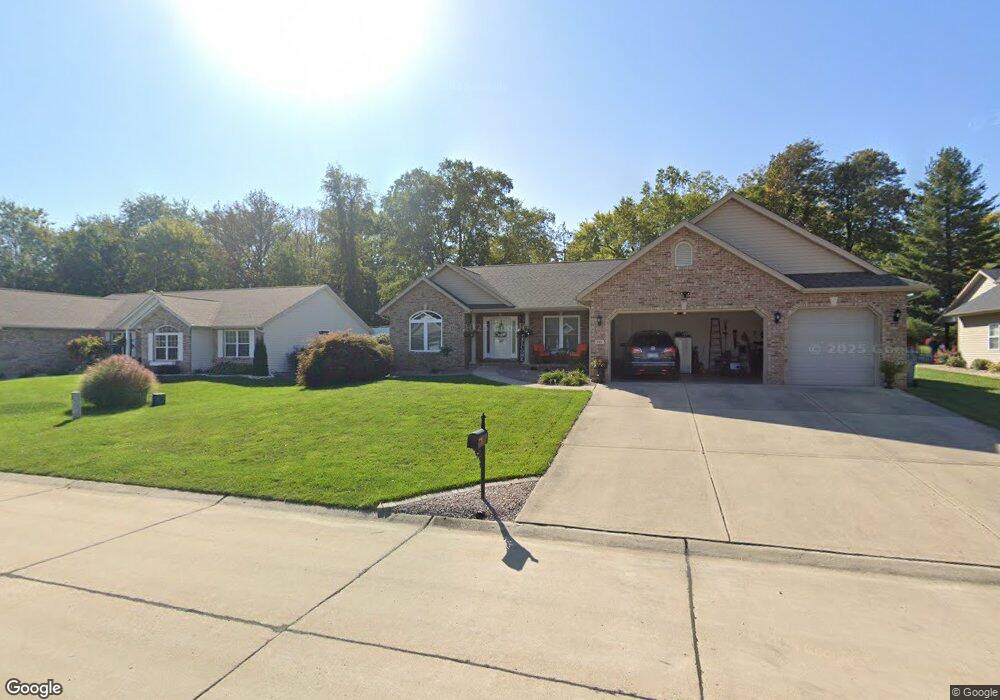
6019 Sunrise Dr Collinsville, IL 62234
Estimated Value: $259,000 - $308,000
4
Beds
4
Baths
700
Sq Ft
$407/Sq Ft
Est. Value
About This Home
This home is located at 6019 Sunrise Dr, Collinsville, IL 62234 and is currently estimated at $284,830, approximately $406 per square foot. 6019 Sunrise Dr is a home located in Madison County with nearby schools including John A Renfro Elementary School, Dorris Intermediate School, and Collinsville Middle School.
Ownership History
Date
Name
Owned For
Owner Type
Purchase Details
Closed on
Jul 10, 2012
Sold by
Hufker William J and Hufker Virginia C
Bought by
Hufker Virginia C and Hufker William J
Current Estimated Value
Purchase Details
Closed on
Mar 31, 2008
Sold by
Jrl Construction Inc
Bought by
Hufker William J and Hufker Virginia C
Home Financials for this Owner
Home Financials are based on the most recent Mortgage that was taken out on this home.
Original Mortgage
$80,000
Outstanding Balance
$51,019
Interest Rate
6.1%
Mortgage Type
Purchase Money Mortgage
Estimated Equity
$233,811
Purchase Details
Closed on
Jun 11, 2007
Sold by
Moseley Frederick D and Fullerton Gregory L
Bought by
Jrl Construction Inc
Home Financials for this Owner
Home Financials are based on the most recent Mortgage that was taken out on this home.
Original Mortgage
$90,000
Interest Rate
8.25%
Mortgage Type
Purchase Money Mortgage
Create a Home Valuation Report for This Property
The Home Valuation Report is an in-depth analysis detailing your home's value as well as a comparison with similar homes in the area
Home Values in the Area
Average Home Value in this Area
Purchase History
| Date | Buyer | Sale Price | Title Company |
|---|---|---|---|
| Hufker Virginia C | -- | None Available | |
| Hufker William J | $100,000 | Abstracts & Titles Inc | |
| Jrl Construction Inc | $78,000 | Chicago Title Insurance Co |
Source: Public Records
Mortgage History
| Date | Status | Borrower | Loan Amount |
|---|---|---|---|
| Open | Hufker William J | $80,000 | |
| Previous Owner | Jrl Construction Inc | $90,000 |
Source: Public Records
Tax History Compared to Growth
Tax History
| Year | Tax Paid | Tax Assessment Tax Assessment Total Assessment is a certain percentage of the fair market value that is determined by local assessors to be the total taxable value of land and additions on the property. | Land | Improvement |
|---|---|---|---|---|
| 2024 | $6,724 | $109,050 | $15,780 | $93,270 |
| 2023 | $6,724 | $100,940 | $14,610 | $86,330 |
| 2022 | $6,418 | $93,340 | $13,510 | $79,830 |
| 2021 | $5,831 | $87,690 | $12,690 | $75,000 |
| 2020 | $5,642 | $83,570 | $12,050 | $71,520 |
| 2019 | $4,469 | $80,710 | $11,640 | $69,070 |
| 2018 | $4,528 | $76,460 | $11,030 | $65,430 |
| 2017 | $4,659 | $74,940 | $10,810 | $64,130 |
| 2016 | $2,993 | $71,300 | $11,490 | $59,810 |
| 2015 | $2,768 | $69,440 | $11,190 | $58,250 |
| 2014 | $2,768 | $50,470 | $11,190 | $39,280 |
| 2013 | $2,768 | $69,440 | $11,190 | $58,250 |
Source: Public Records
Map
Nearby Homes
- 54 Oak Leaf Dr
- 22 Oak Valley Dr
- 6020 Keebler Oaks Dr
- 104 Summit Ridge Unit 104
- 2704 Stone Valley Dr
- 2723 Keebler Rd
- 2708 Fieldstone Dr
- 625 W Country Ln
- 2790 Deerfield Dr
- 912 Oakridge Dr
- 5 Deer Trail Dr
- 1029 Andra Dr
- 19 Chelsea Rd
- 1014 Daniel Dr
- 1005 Daniel Dr
- 2 Chelsea Rd
- 6 Doe Run Trail
- 58 Stonebridge Crossing Dr
- 54 Stonebridge Crossing Dr
- 50 Stonebridge Crossing Dr
- 6023 Sunrise Dr
- 70 Oak Leaf Dr
- 62 Oak Leaf Dr
- 58 Oak Leaf Dr
- 66 Oak Leaf Dr
- 50 Oak Leaf Dr
- 6017 Sunrise Dr
- 6031 Sunrise Dr
- 37 Oak Leaf Dr
- 33 Oak Leaf Dr
- 74 Oak Leaf Dr
- 29 Oak Leaf Dr
- 6013 Sunrise Dr
- 41 Oak Leaf Dr
- 46 Oak Leaf Dr
- 49 Oak Leaf Dr
- 45 Oak Leaf Dr
- 42 Oak Leaf Dr
- 6018 Sunrise Dr
- 21 Oak Leaf Dr