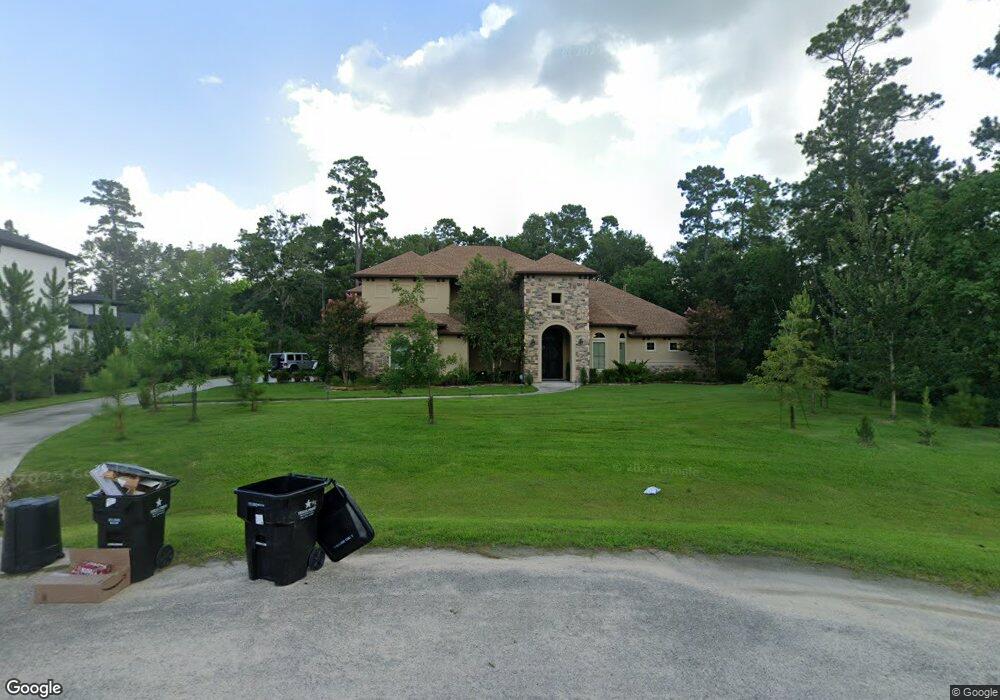
6019 White Birch Run Spring, TX 77386
Benders Landing NeighborhoodEstimated Value: $1,169,000 - $1,436,000
Studio
1
Bath
4,510
Sq Ft
$290/Sq Ft
Est. Value
About This Home
This home is located at 6019 White Birch Run, Spring, TX 77386 and is currently estimated at $1,308,922, approximately $290 per square foot. 6019 White Birch Run is a home located in Montgomery County with nearby schools including York J High School and Grand Oaks High School.
Ownership History
Date
Name
Owned For
Owner Type
Purchase Details
Closed on
Aug 4, 2021
Sold by
Milbaum Doron S and Reynolds Milbaum Theresa
Bought by
Hancock Robert N and Hancock Jennifer C
Current Estimated Value
Home Financials for this Owner
Home Financials are based on the most recent Mortgage that was taken out on this home.
Original Mortgage
$736,000
Outstanding Balance
$670,250
Interest Rate
3%
Mortgage Type
New Conventional
Estimated Equity
$638,672
Purchase Details
Closed on
Nov 1, 2016
Sold by
Perry Homes Llc
Bought by
Milbaum Doron S and Reynolds Milbaum Theresa M A
Purchase Details
Closed on
Sep 11, 2013
Sold by
Jankoski Kane Philip
Bought by
Perry Homes Llc
Purchase Details
Closed on
Jul 20, 2009
Sold by
Lgi Land Llc
Bought by
Jankoski Kane
Home Financials for this Owner
Home Financials are based on the most recent Mortgage that was taken out on this home.
Original Mortgage
$77,310
Interest Rate
5.71%
Mortgage Type
Purchase Money Mortgage
Create a Home Valuation Report for This Property
The Home Valuation Report is an in-depth analysis detailing your home's value as well as a comparison with similar homes in the area
Home Values in the Area
Average Home Value in this Area
Purchase History
| Date | Buyer | Sale Price | Title Company |
|---|---|---|---|
| Hancock Robert N | -- | Fidelity National Title | |
| Milbaum Doron S | -- | Chicago Title | |
| Perry Homes Llc | -- | Chicago Title | |
| Jankoski Kane | -- | American Title Company | |
| Milbaum Doron | -- | -- |
Source: Public Records
Mortgage History
| Date | Status | Borrower | Loan Amount |
|---|---|---|---|
| Open | Hancock Robert N | $736,000 | |
| Previous Owner | Milbaum Doron | $77,310 |
Source: Public Records
Tax History
| Year | Tax Paid | Tax Assessment Tax Assessment Total Assessment is a certain percentage of the fair market value that is determined by local assessors to be the total taxable value of land and additions on the property. | Land | Improvement |
|---|---|---|---|---|
| 2025 | $15,284 | $1,155,000 | $402,403 | $752,597 |
| 2024 | $13,783 | $1,100,000 | -- | -- |
| 2023 | $13,783 | $1,062,040 | $249,230 | $947,870 |
| 2022 | $16,752 | $965,490 | $225,660 | $739,830 |
| 2021 | $16,588 | $897,300 | $137,600 | $783,020 |
| 2020 | $15,859 | $815,730 | $137,600 | $678,130 |
| 2019 | $16,080 | $798,240 | $143,970 | $654,270 |
| 2018 | $10,428 | $517,690 | $143,970 | $373,720 |
| 2017 | $2,896 | $143,970 | $143,970 | $0 |
| 2016 | $2,896 | $143,970 | $143,970 | $0 |
| 2015 | $1,995 | $143,970 | $143,970 | $0 |
| 2014 | $1,995 | $98,200 | $98,200 | $0 |
Source: Public Records
Map
Nearby Homes
- 5906 Sunny Sky Place
- 27307 Sgt Taylor Memorial
- 5802 Sunny Sky Place
- 27402 W Balsam Fir Cir
- 6007 N Ossineke Dr
- 27403 W Balsam Fir Cir
- 27583 S Lazy Meadow Way
- 5510 Pine Wood Meadows Ln
- 27560 S Lazy Meadow Way
- 27507 Hunter Creek Ct
- 27614 Little Fox Crest
- 5402 White Birch Run
- 27306 Owosso Ct
- 27302 Keystone Bend Ct
- 27494 S Lazy Meadow Way
- 4447 Chateau Creek Way
- 27223 Blue Cedar Ln
- 27318 Blue Cedar Ln
- 4430 Chateau Creek Way
- 4938 Northern Woods Dr
- 6015 White Birch Run
- 27527 Wishing Oak Landing
- 27519 Wishing Oak Landing
- 6022 White Birch Run
- 27603 Wishing Oak Lndg Landing
- 6007 White Birch Run
- 6014 White Birch Run
- 27515 Wishing Oak Landing
- 27607 Wishing Oak Landing
- 27526 Wishing Oak Lnd
- 27603 Wishing Oak Landing
- 27603 Wishing Oak Lnd
- 6003 White Birch Run
- 27511 Wishing Oak Landing
- 27414 Sgt Taylor Memorial
- 27526 Wishing Oak Landing
- 27511 Wishing Oak Lnd
- 27602 Wishing Oak Landing
- 27522 Wishing Oak Landing
- 5914 Sunny Sky Place
Your Personal Tour Guide
Ask me questions while you tour the home.