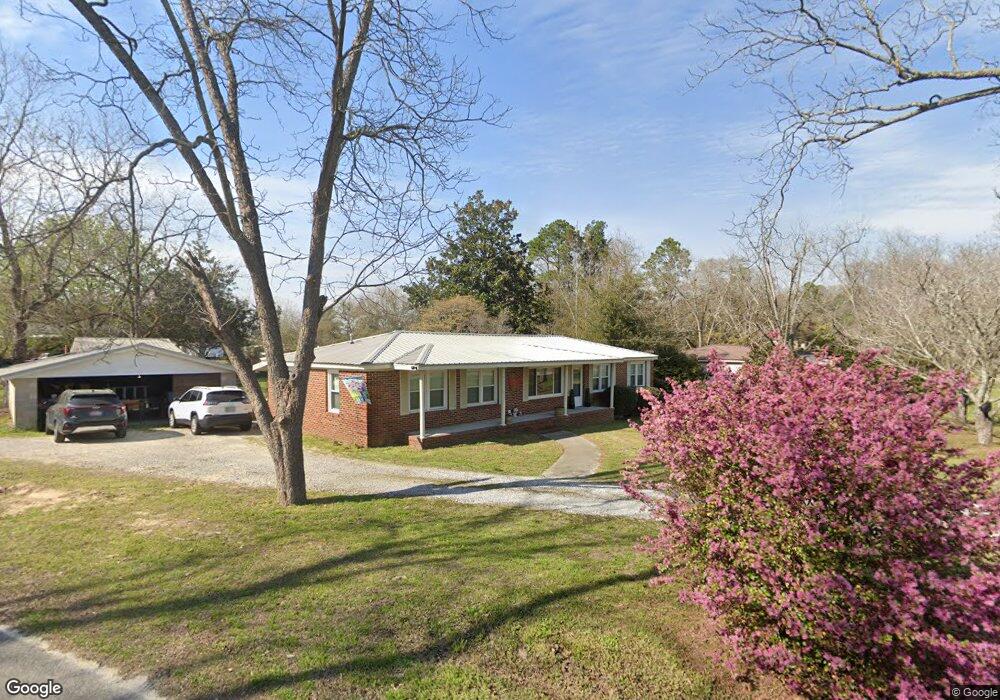
602 Calhoun St Gibson, GA 30810
Estimated Value: $135,000 - $236,000
4
Beds
2
Baths
1,964
Sq Ft
$94/Sq Ft
Est. Value
About This Home
This home is located at 602 Calhoun St, Gibson, GA 30810 and is currently estimated at $184,726, approximately $94 per square foot. 602 Calhoun St is a home located in Glascock County with nearby schools including Glascock County Consolidated School.
Ownership History
Date
Name
Owned For
Owner Type
Purchase Details
Closed on
Feb 3, 2012
Sold by
Tiner Anna Chalker
Bought by
Chalker William A and Tiner Anna E
Current Estimated Value
Home Financials for this Owner
Home Financials are based on the most recent Mortgage that was taken out on this home.
Original Mortgage
$108,228
Interest Rate
3.92%
Mortgage Type
New Conventional
Purchase Details
Closed on
May 4, 2009
Sold by
Chalker William A and Chalker William Anderson
Bought by
Tiner Anna Chalker
Purchase Details
Closed on
May 11, 2006
Sold by
Adams Brian
Bought by
Chalker William A and Chalker Barbara F
Purchase Details
Closed on
Aug 2, 2004
Sold by
Poythress Rhonda
Bought by
Adams Brian and Adams Angie
Purchase Details
Closed on
Sep 13, 2000
Sold by
Poythress Benjamin T
Bought by
Poythress Rhonda
Purchase Details
Closed on
Dec 10, 1996
Sold by
Marsh Louise
Bought by
Poythress Benjamin T
Create a Home Valuation Report for This Property
The Home Valuation Report is an in-depth analysis detailing your home's value as well as a comparison with similar homes in the area
Purchase History
| Date | Buyer | Sale Price | Title Company |
|---|---|---|---|
| Chalker William A | -- | -- | |
| Tiner Anna Chalker | -- | -- | |
| Chalker William A | $127,500 | -- | |
| Adams Brian | $88,600 | -- | |
| Poythress Rhonda | -- | -- | |
| Poythress Benjamin T | $40,000 | -- |
Source: Public Records
Mortgage History
| Date | Status | Borrower | Loan Amount |
|---|---|---|---|
| Closed | Chalker William A | $108,228 | |
| Closed | Chalker William A | $0 |
Source: Public Records
Tax History
| Year | Tax Paid | Tax Assessment Tax Assessment Total Assessment is a certain percentage of the fair market value that is determined by local assessors to be the total taxable value of land and additions on the property. | Land | Improvement |
|---|---|---|---|---|
| 2025 | $1,606 | $58,399 | $1,400 | $56,999 |
| 2024 | $1,607 | $58,399 | $1,400 | $56,999 |
| 2023 | $1,082 | $61,126 | $1,400 | $59,726 |
| 2022 | $1,461 | $55,674 | $1,400 | $54,274 |
| 2021 | $959 | $34,355 | $1,400 | $32,955 |
| 2020 | $927 | $34,355 | $1,400 | $32,955 |
| 2019 | $927 | $34,355 | $1,400 | $32,955 |
| 2018 | $1,085 | $34,355 | $1,400 | $32,955 |
| 2017 | $926 | $34,355 | $1,400 | $32,955 |
| 2016 | $926 | $34,355 | $1,400 | $32,955 |
| 2015 | -- | $36,757 | $1,400 | $35,357 |
| 2014 | -- | $36,757 | $1,400 | $35,357 |
| 2013 | -- | $36,757 | $1,400 | $35,357 |
Source: Public Records
Map
Nearby Homes
- 99 W Main St
- Tract A Georgia 102
- Tract B Georgia 102
- 2302 Avant Chalker Rd
- 3832 Georgia 102
- 4050 Foxridge Rd
- 5559 Mill Creek Church Rd
- Edford Reese Rd
- Edford Reese Rd
- 9694 Broad St
- Edford Reese Rd
- 5257 Blume Rd
- Edford Reese Rd
- Edford Reese Rd
- 15094 Clarks Mill Rd
- 3275 Hadden Pond Rd
- 0 Georgia 171
- 0 Buck Rd Unit LotWP001 24720525
- 2729 Hadden Pond Rd
- 6906 Georgia 171
Your Personal Tour Guide
Ask me questions while you tour the home.