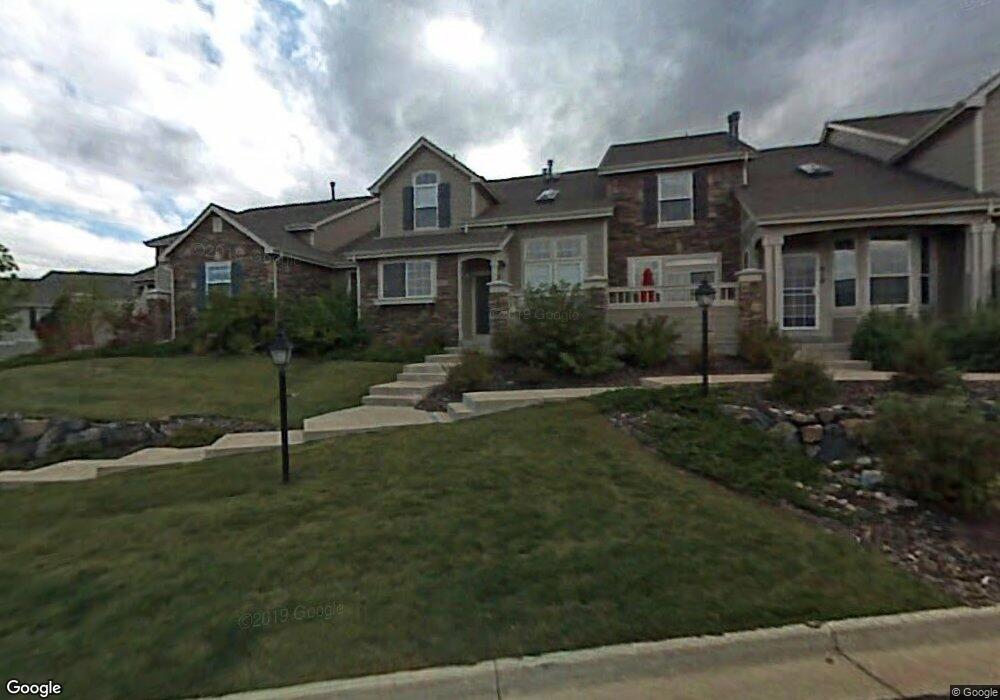
602 Clarendon Loop Castle Pines, CO 80108
Estimated Value: $513,177 - $618,000
2
Beds
3
Baths
2,415
Sq Ft
$231/Sq Ft
Est. Value
About This Home
This home is located at 602 Clarendon Loop, Castle Pines, CO 80108 and is currently estimated at $557,044, approximately $230 per square foot. 602 Clarendon Loop is a home located in Douglas County with nearby schools including Buffalo Ridge Elementary School, Rocky Heights Middle School, and Rock Canyon High School.
Ownership History
Date
Name
Owned For
Owner Type
Purchase Details
Closed on
Jun 4, 2013
Sold by
Espinosa George
Bought by
Schissler Dennis A and Young Christine M
Current Estimated Value
Home Financials for this Owner
Home Financials are based on the most recent Mortgage that was taken out on this home.
Original Mortgage
$157,500
Outstanding Balance
$32,171
Interest Rate
3.43%
Mortgage Type
New Conventional
Estimated Equity
$524,873
Purchase Details
Closed on
Nov 28, 2000
Sold by
The Writer Corporation
Bought by
Espinosa George
Home Financials for this Owner
Home Financials are based on the most recent Mortgage that was taken out on this home.
Original Mortgage
$182,600
Interest Rate
7.84%
Purchase Details
Closed on
Aug 25, 2000
Sold by
Writer Corporation
Bought by
Twc Acquistion Corp Fka The Writer Corpo
Create a Home Valuation Report for This Property
The Home Valuation Report is an in-depth analysis detailing your home's value as well as a comparison with similar homes in the area
Home Values in the Area
Average Home Value in this Area
Purchase History
| Date | Buyer | Sale Price | Title Company |
|---|---|---|---|
| Schissler Dennis A | $247,500 | Fidelity National Title Insu | |
| Espinosa George | $228,297 | Land Title | |
| Twc Acquistion Corp Fka The Writer Corpo | -- | -- |
Source: Public Records
Mortgage History
| Date | Status | Borrower | Loan Amount |
|---|---|---|---|
| Open | Schissler Dennis A | $157,500 | |
| Previous Owner | Espinosa George | $182,600 |
Source: Public Records
Tax History
| Year | Tax Paid | Tax Assessment Tax Assessment Total Assessment is a certain percentage of the fair market value that is determined by local assessors to be the total taxable value of land and additions on the property. | Land | Improvement |
|---|---|---|---|---|
| 2025 | $2,487 | $31,530 | $6,250 | $25,280 |
| 2024 | $2,487 | $35,520 | $5,960 | $29,560 |
| 2023 | $3,180 | $35,520 | $5,960 | $29,560 |
| 2022 | $2,496 | $25,880 | $1,740 | $24,140 |
| 2021 | $2,594 | $25,880 | $1,740 | $24,140 |
| 2020 | $2,517 | $24,920 | $1,790 | $23,130 |
| 2019 | $2,525 | $24,920 | $1,790 | $23,130 |
| 2018 | $2,375 | $23,110 | $1,800 | $21,310 |
| 2017 | $2,231 | $23,110 | $1,800 | $21,310 |
| 2016 | $2,338 | $21,270 | $1,990 | $19,280 |
| 2015 | $2,598 | $21,270 | $1,990 | $19,280 |
| 2014 | $2,278 | $17,780 | $1,990 | $15,790 |
Source: Public Records
Map
Nearby Homes
- 7387 Norfolk Place
- 7463 Norfolk Place
- 7243 Somerset Ct
- 7412 Pembroke Ct
- 7350 Brixham Cir
- 368 Woodstock Ln
- 939 Greenway Ln
- 6879 Ingleton Dr
- 1055 Deer Clover Way
- 581 Stonemont Dr
- 1033 Buffalo Ridge Rd
- 990 Glen Oaks Ave
- 369 Shoreham Cir
- 1255 Forest Trails Dr
- 8114 Briar Ridge Dr
- 6299 Ellingwood Point Place
- 7133 Hyland Hills St
- 976 Country Club Pkwy
- 1277 Forest Trails Dr
- 1251 Buffalo Ridge Rd
- 610 Clarendon Loop
- 594 Clarendon Loop
- 618 Clarendon Loop
- 648 Clarendon Loop
- 656 Clarendon Loop
- 640 Clarendon Loop
- 664 Clarendon Loop
- 586 Clarendon Loop
- 578 Clarendon Loop
- 641 Clarendon Loop
- 472 Clarendon Loop
- 593 Clarendon Loop
- 609 Clarendon Loop
- 649 Clarendon Loop
- 464 Clarendon Loop
- 657 Clarendon Loop
- 625 Clarendon Loop
- 597 Clarendon Loop
- 456 Clarendon Loop
- 617 Clarendon Loop
Your Personal Tour Guide
Ask me questions while you tour the home.