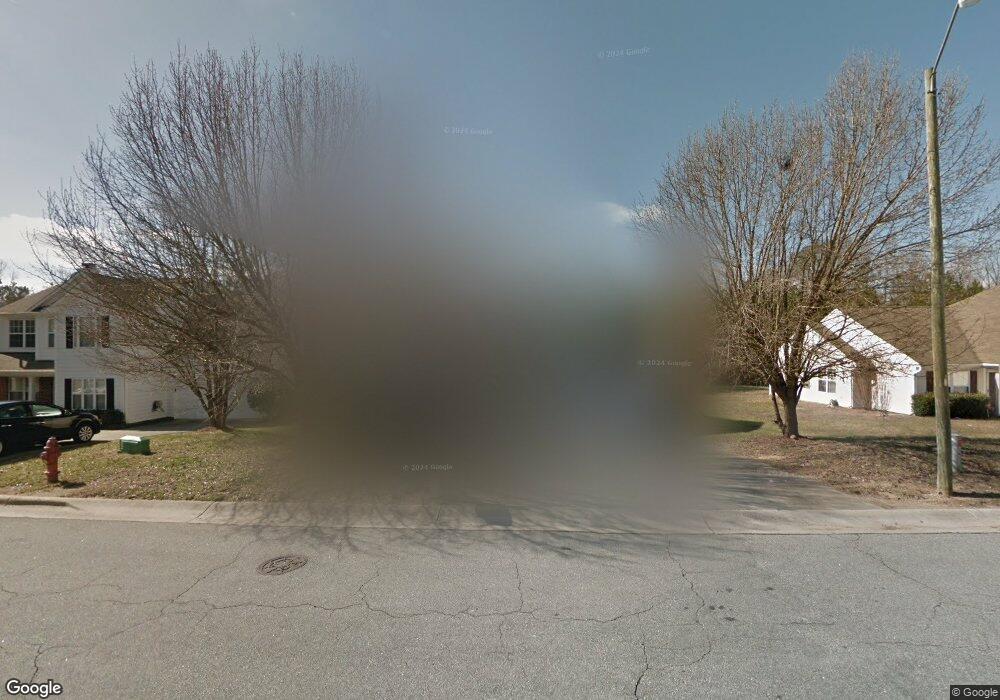
602 Crossview Ln Durham, NC 27703
Eastern Durham NeighborhoodEstimated Value: $346,594 - $386,000
3
Beds
3
Baths
1,560
Sq Ft
$238/Sq Ft
Est. Value
About This Home
This home is located at 602 Crossview Ln, Durham, NC 27703 and is currently estimated at $370,649, approximately $237 per square foot. 602 Crossview Ln is a home located in Durham County with nearby schools including Oak Grove Elementary, John W Neal Middle School, and Southern School of Energy & Sustainability.
Ownership History
Date
Name
Owned For
Owner Type
Purchase Details
Closed on
Feb 28, 2001
Sold by
D R Horton Inc Torrey
Bought by
Abrea Maricar E
Current Estimated Value
Home Financials for this Owner
Home Financials are based on the most recent Mortgage that was taken out on this home.
Original Mortgage
$140,790
Outstanding Balance
$51,419
Interest Rate
7.06%
Mortgage Type
FHA
Estimated Equity
$319,230
Create a Home Valuation Report for This Property
The Home Valuation Report is an in-depth analysis detailing your home's value as well as a comparison with similar homes in the area
Home Values in the Area
Average Home Value in this Area
Purchase History
| Date | Buyer | Sale Price | Title Company |
|---|---|---|---|
| Abrea Maricar E | $143,000 | -- |
Source: Public Records
Mortgage History
| Date | Status | Borrower | Loan Amount |
|---|---|---|---|
| Open | Abrea Maricar E | $140,790 |
Source: Public Records
Tax History Compared to Growth
Tax History
| Year | Tax Paid | Tax Assessment Tax Assessment Total Assessment is a certain percentage of the fair market value that is determined by local assessors to be the total taxable value of land and additions on the property. | Land | Improvement |
|---|---|---|---|---|
| 2025 | $2,007 | $337,416 | $63,268 | $274,148 |
| 2024 | $2,756 | $197,558 | $46,012 | $151,546 |
| 2023 | $2,588 | $197,558 | $46,012 | $151,546 |
| 2022 | $2,529 | $197,558 | $46,012 | $151,546 |
| 2021 | $2,517 | $197,558 | $46,012 | $151,546 |
| 2020 | $2,457 | $197,558 | $46,012 | $151,546 |
| 2019 | $2,457 | $197,558 | $46,012 | $151,546 |
| 2018 | $2,112 | $155,728 | $33,742 | $121,986 |
| 2017 | $2,097 | $155,728 | $33,742 | $121,986 |
| 2016 | $2,026 | $155,728 | $33,742 | $121,986 |
| 2015 | $2,153 | $155,536 | $35,469 | $120,067 |
| 2014 | $2,153 | $155,536 | $35,469 | $120,067 |
Source: Public Records
Map
Nearby Homes
- 604 Bellmeade Bay Dr
- 907 Danbury Dr
- 16 Vestrial Ln
- 516 Guy Walker Way
- 1315 Pennock Rd
- 210 Stoney Creek Cir
- 1107 High Fox Dr
- 2117 Fletchers Ridge Dr
- 1015 Sora Way
- 208 Lick Creek Ln
- 111 Glenview Ln
- 610 Sherron Rd
- 622 Sherron Rd
- 110 Kindlewood Dr
- 148 Daneborg Rd
- 517 Keith St
- 3311 Delmar Dr
- 416 Chivalry Dr
- 142 Token House Rd
- 140 Token House Rd
- 604 Crossview Ln
- 540 Crossview Ln
- 608 Crossview Ln
- 538 Crossview Ln
- 205 Leacroft Way
- 610 Crossview Ln
- 607 Crossview Ln
- 539 Crossview Ln
- 536 Crossview Ln
- 203 Leacroft Way
- 612 Crossview Ln
- 534 Crossview Ln
- 535 Crossview Ln
- 135 Leacroft Way
- 720 Bellmeade Bay Dr
- 611 Crossview Ln
- 614 Crossview Ln
- 718 Bellmeade Bay Dr
- 533 Crossview Ln
- 532 Crossview Ln
