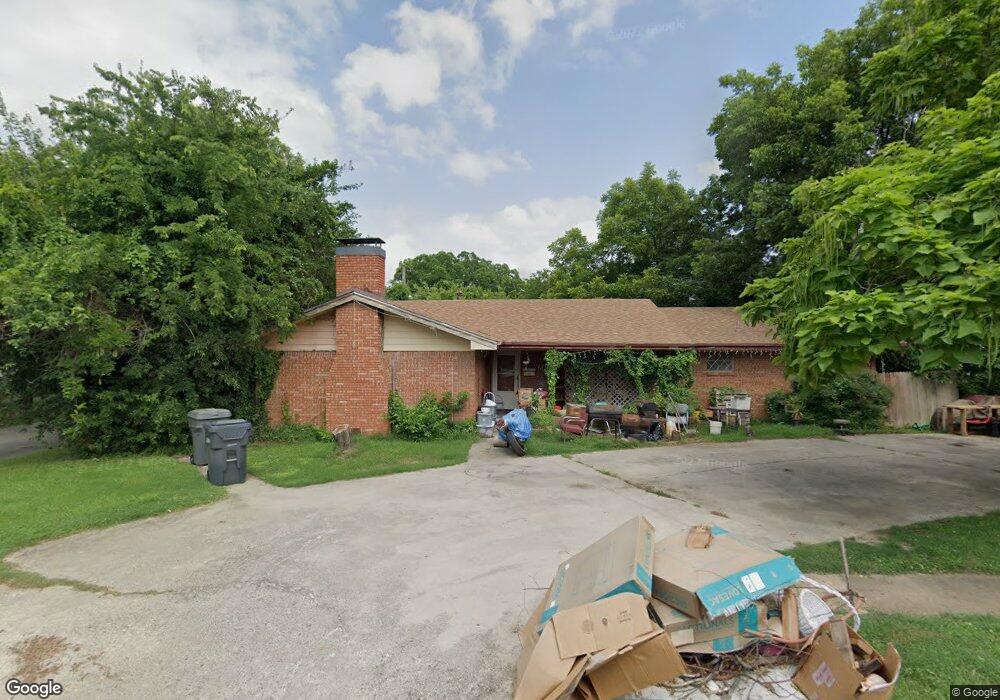
602 D St SE Ardmore, OK 73401
Estimated Value: $127,000 - $170,243
3
Beds
2
Baths
1,965
Sq Ft
$79/Sq Ft
Est. Value
About This Home
This home is located at 602 D St SE, Ardmore, OK 73401 and is currently estimated at $154,311, approximately $78 per square foot. 602 D St SE is a home located in Carter County with nearby schools including Jefferson Elementary School, Ardmore Middle School, and Ardmore High School.
Ownership History
Date
Name
Owned For
Owner Type
Purchase Details
Closed on
Jun 10, 2005
Sold by
Williams Shane and Williams Andrea
Bought by
Collins Harlan and Collins Birdie Lou
Current Estimated Value
Home Financials for this Owner
Home Financials are based on the most recent Mortgage that was taken out on this home.
Original Mortgage
$69,250
Outstanding Balance
$35,689
Interest Rate
5.76%
Mortgage Type
VA
Estimated Equity
$118,622
Purchase Details
Closed on
Dec 7, 2001
Sold by
Fedric Gilbert L and Fedric May
Bought by
Collins Harlan Earl
Purchase Details
Closed on
Aug 7, 1997
Sold by
Lighthouse Assembly Of Go
Bought by
Fedric Gilbert L and Fedric Ma
Create a Home Valuation Report for This Property
The Home Valuation Report is an in-depth analysis detailing your home's value as well as a comparison with similar homes in the area
Purchase History
| Date | Buyer | Sale Price | Title Company |
|---|---|---|---|
| Collins Harlan | -- | -- | |
| Collins Harlan Earl | $65,000 | -- | |
| Fedric Gilbert L | $56,000 | -- |
Source: Public Records
Mortgage History
| Date | Status | Borrower | Loan Amount |
|---|---|---|---|
| Open | Collins Harlan | $69,250 |
Source: Public Records
Tax History
| Year | Tax Paid | Tax Assessment Tax Assessment Total Assessment is a certain percentage of the fair market value that is determined by local assessors to be the total taxable value of land and additions on the property. | Land | Improvement |
|---|---|---|---|---|
| 2025 | $1,129 | $12,318 | $900 | $11,418 |
| 2024 | $1,130 | $11,959 | $900 | $11,059 |
| 2023 | $1,094 | $11,611 | $900 | $10,711 |
| 2022 | $982 | $11,273 | $900 | $10,373 |
| 2021 | $1,003 | $10,944 | $900 | $10,044 |
| 2020 | $957 | $10,626 | $900 | $9,726 |
| 2019 | $935 | $10,626 | $900 | $9,726 |
| 2018 | $973 | $10,857 | $900 | $9,957 |
| 2017 | $968 | $11,588 | $900 | $10,688 |
| 2016 | $1,001 | $11,738 | $540 | $11,198 |
| 2015 | $905 | $12,783 | $540 | $12,243 |
| 2014 | $1,061 | $12,857 | $496 | $12,361 |
Source: Public Records
Map
Nearby Homes