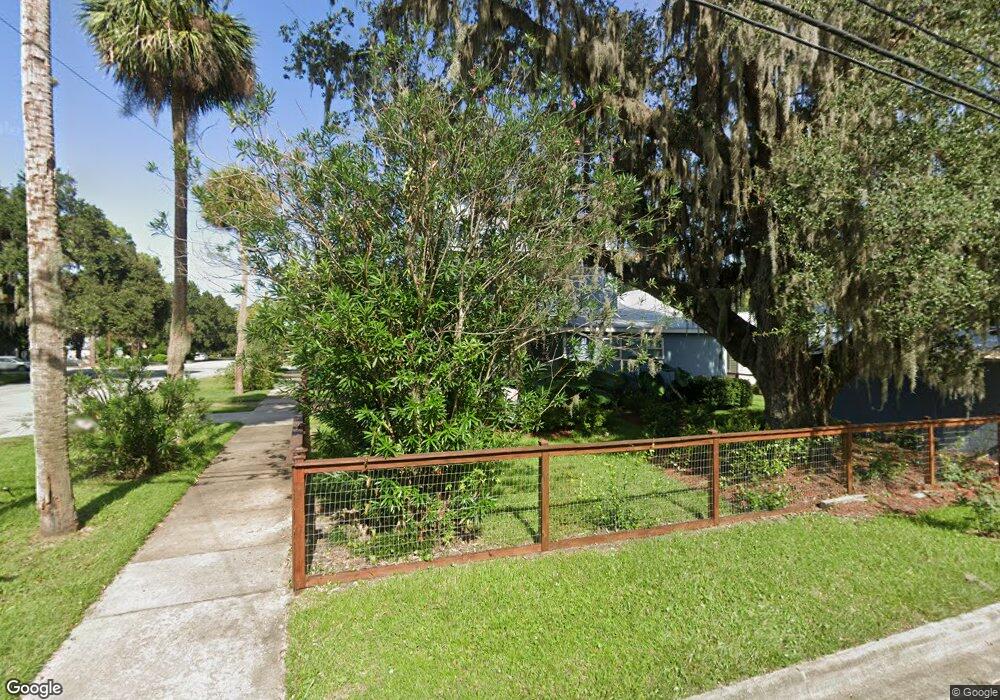
602 Dartmouth St Brunswick, GA 31520
Old Town NeighborhoodEstimated Value: $214,000 - $396,000
3
Beds
2
Baths
2,072
Sq Ft
$139/Sq Ft
Est. Value
About This Home
This home is located at 602 Dartmouth St, Brunswick, GA 31520 and is currently estimated at $288,772, approximately $139 per square foot. 602 Dartmouth St is a home located in Glynn County with nearby schools including Oglethorpe Point Elementary School, Glynn Middle School, and Glynn Academy.
Ownership History
Date
Name
Owned For
Owner Type
Purchase Details
Closed on
Apr 7, 2017
Bought by
Christiansen Rosemarie and Mann Warren C
Current Estimated Value
Purchase Details
Closed on
Jan 10, 2017
Sold by
Nationstar Mtg Llc
Bought by
Mtg Equity Conversion Asset Tr
Purchase Details
Closed on
Dec 6, 2016
Sold by
Ross Lois F
Bought by
Nationstar Mtg Llc
Purchase Details
Closed on
Feb 8, 2006
Sold by
Ross Leo L
Bought by
Ross Lois F
Create a Home Valuation Report for This Property
The Home Valuation Report is an in-depth analysis detailing your home's value as well as a comparison with similar homes in the area
Home Values in the Area
Average Home Value in this Area
Purchase History
| Date | Buyer | Sale Price | Title Company |
|---|---|---|---|
| Christiansen Rosemarie | $110,000 | -- | |
| Mtg Equity Conversion Asset Tr | -- | -- | |
| Nationstar Mtg Llc | -- | -- | |
| Ross Lois F | -- | -- |
Source: Public Records
Tax History Compared to Growth
Tax History
| Year | Tax Paid | Tax Assessment Tax Assessment Total Assessment is a certain percentage of the fair market value that is determined by local assessors to be the total taxable value of land and additions on the property. | Land | Improvement |
|---|---|---|---|---|
| 2025 | $1,832 | $87,160 | $9,588 | $77,572 |
| 2024 | $1,832 | $87,160 | $9,720 | $77,440 |
| 2023 | $1,701 | $64,840 | $9,720 | $55,120 |
| 2022 | $2,301 | $64,840 | $9,720 | $55,120 |
| 2021 | $2,106 | $54,840 | $9,720 | $45,120 |
| 2020 | $2,121 | $54,840 | $9,720 | $45,120 |
| 2019 | $881 | $46,040 | $9,720 | $36,320 |
| 2018 | $883 | $44,000 | $9,720 | $34,280 |
| 2017 | $1,124 | $57,640 | $9,720 | $47,920 |
| 2016 | $1,031 | $57,640 | $9,720 | $47,920 |
| 2015 | $1,414 | $55,040 | $9,720 | $45,320 |
| 2014 | $1,414 | $57,000 | $11,680 | $45,320 |
Source: Public Records
Map
Nearby Homes
- 501 Dartmouth St
- 508 Albemarle St Unit A-D
- 627 Newcastle St
- 903 Dartmouth St
- 815 Union St
- 911 Union St
- 1300 Dartmouth St
- 912 Carpenter St
- 816 Amherst St
- 314 Norwich St
- 911 Amherst St
- 1408 Prince St
- 1410 Prince St
- 917 Amherst St
- 213 Union St
- 1308 George St
- 114 Greer Dr
- 1208 Union St
- 716 Gordon St
- 1303 Union St