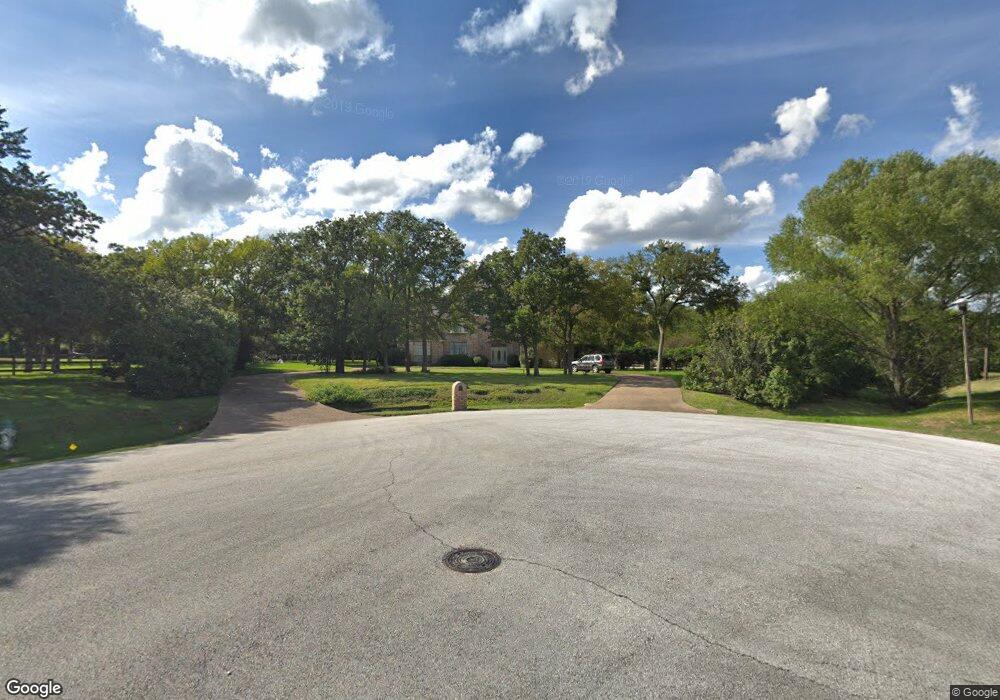
602 Dene Ct Southlake, TX 76092
Estimated Value: $1,092,000 - $1,510,080
4
Beds
3
Baths
3,509
Sq Ft
$371/Sq Ft
Est. Value
About This Home
This home is located at 602 Dene Ct, Southlake, TX 76092 and is currently estimated at $1,301,040, approximately $370 per square foot. 602 Dene Ct is a home located in Tarrant County with nearby schools including Jack D. Johnson Elementary, Don T. Durham Intermediate School, and Carroll Middle School.
Ownership History
Date
Name
Owned For
Owner Type
Purchase Details
Closed on
May 23, 2001
Sold by
Rodriguez Irma Garciade
Bought by
Saladino Dan M and Saladino Elizabeth
Current Estimated Value
Home Financials for this Owner
Home Financials are based on the most recent Mortgage that was taken out on this home.
Original Mortgage
$273,558
Outstanding Balance
$102,675
Interest Rate
7.1%
Estimated Equity
$1,198,365
Purchase Details
Closed on
May 16, 2001
Sold by
Rodrigues Monica
Bought by
Saladino Dan M and Saladino Elizabeth
Home Financials for this Owner
Home Financials are based on the most recent Mortgage that was taken out on this home.
Original Mortgage
$273,558
Outstanding Balance
$102,675
Interest Rate
7.1%
Estimated Equity
$1,198,365
Create a Home Valuation Report for This Property
The Home Valuation Report is an in-depth analysis detailing your home's value as well as a comparison with similar homes in the area
Home Values in the Area
Average Home Value in this Area
Purchase History
| Date | Buyer | Sale Price | Title Company |
|---|---|---|---|
| Saladino Dan M | -- | North American Title Co | |
| Saladino Dan M | -- | North American Title Co |
Source: Public Records
Mortgage History
| Date | Status | Borrower | Loan Amount |
|---|---|---|---|
| Open | Saladino Dan M | $273,558 |
Source: Public Records
Tax History Compared to Growth
Tax History
| Year | Tax Paid | Tax Assessment Tax Assessment Total Assessment is a certain percentage of the fair market value that is determined by local assessors to be the total taxable value of land and additions on the property. | Land | Improvement |
|---|---|---|---|---|
| 2025 | $12,353 | $1,130,160 | $725,100 | $405,060 |
| 2024 | $12,353 | $1,439,902 | $725,100 | $714,802 |
| 2023 | $13,679 | $1,352,352 | $725,100 | $627,252 |
| 2022 | $14,719 | $942,453 | $541,750 | $400,703 |
| 2021 | $14,141 | $812,400 | $541,750 | $270,650 |
| 2020 | $12,960 | $768,399 | $583,400 | $184,999 |
| 2019 | $12,412 | $768,399 | $583,400 | $184,999 |
| 2018 | $10,522 | $465,983 | $421,740 | $44,243 |
| 2017 | $10,500 | $645,062 | $383,400 | $261,662 |
| 2016 | $9,545 | $619,418 | $383,900 | $235,518 |
| 2015 | $8,393 | $350,100 | $90,000 | $260,100 |
| 2014 | $8,393 | $350,100 | $90,000 | $260,100 |
Source: Public Records
Map
Nearby Homes
- 1018 Quail Run Rd
- 1006 Quail Run Rd
- 1013 Winfield Ct
- 424 Saint Tropez Dr
- 2112 Beaver Creek Ln
- 2920 Burney Ln
- 5 W Dove Rd
- 136 Sweet St
- 212 Saint Tropez Dr
- 1099 Burney Ln
- 3179 Southlake Park Rd
- 415 Marshall Rd
- 1340 Burney Ln
- 1828 Riviera Ln
- 1820 Riviera Ln
- 1812 Riviera Ln
- 1821 Cannes Cir
- 1497 E Dove Rd
- 1829 Cannes Cir
- 200 Murphy Dr
- 702 Harty Ct
- 1017 Quail Run Rd
- 603 Dene Ct
- 806 Victoria Ln
- 650 E Dove Rd
- 705 Harty Ct
- 1021 Quail Run Rd
- 1014 Quail Run Rd
- 1016 Quail Run Rd
- 802 Victoria Ln
- 808 Victoria Ln
- 1020 Quail Run Rd
- 807 Victoria Ln
- 805 Victoria Ln
- 703 Harty Ct
- 1013 Quail Run Rd
- 670 E Dove Rd
- 1011 Quail Run Rd
- 740 E Dove Rd
- 803 Victoria Ln