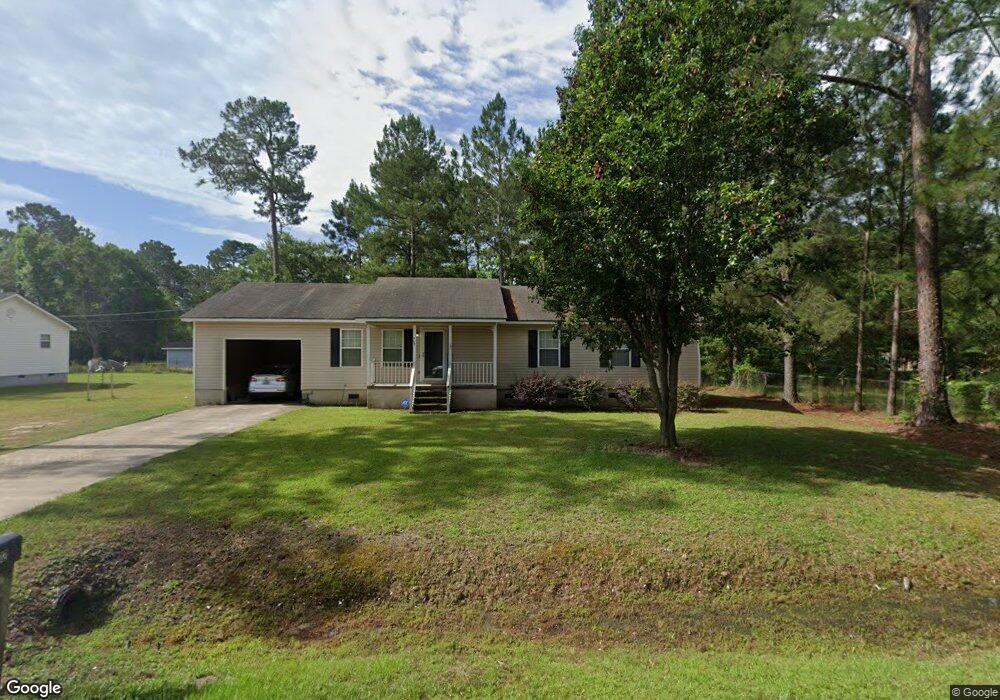
602 E 28th Ave Cordele, GA 31015
Estimated Value: $164,692 - $197,000
3
Beds
2
Baths
1,800
Sq Ft
$99/Sq Ft
Est. Value
About This Home
This home is located at 602 E 28th Ave, Cordele, GA 31015 and is currently estimated at $177,423, approximately $98 per square foot. 602 E 28th Ave is a home located in Crisp County with nearby schools including Crisp County Elementary School, Crisp County Primary School, and Crisp County Middle School.
Ownership History
Date
Name
Owned For
Owner Type
Purchase Details
Closed on
Aug 18, 2021
Sold by
Jones Pamela E
Bought by
Postell Pamela
Current Estimated Value
Home Financials for this Owner
Home Financials are based on the most recent Mortgage that was taken out on this home.
Original Mortgage
$68,395
Outstanding Balance
$39,375
Interest Rate
2.7%
Mortgage Type
Commercial
Estimated Equity
$138,048
Purchase Details
Closed on
Sep 16, 2005
Sold by
Gilliam Kellie H
Bought by
Jones Pamela E
Home Financials for this Owner
Home Financials are based on the most recent Mortgage that was taken out on this home.
Original Mortgage
$86,000
Interest Rate
5.77%
Mortgage Type
New Conventional
Purchase Details
Closed on
Apr 15, 2004
Sold by
Zervas Dino
Bought by
Bledsoe Kellie H
Purchase Details
Closed on
Nov 5, 2002
Sold by
Zervas George
Bought by
Zervas Dino
Purchase Details
Closed on
Dec 2, 1980
Bought by
Zervas George
Create a Home Valuation Report for This Property
The Home Valuation Report is an in-depth analysis detailing your home's value as well as a comparison with similar homes in the area
Purchase History
| Date | Buyer | Sale Price | Title Company |
|---|---|---|---|
| Postell Pamela | -- | -- | |
| Jones Pamela E | $86,000 | -- | |
| Bledsoe Kellie H | $78,000 | -- | |
| Zervas Dino | -- | -- | |
| Zervas George | $7,500 | -- |
Source: Public Records
Mortgage History
| Date | Status | Borrower | Loan Amount |
|---|---|---|---|
| Open | Postell Pamela | $68,395 | |
| Previous Owner | Jones Pamela E | $86,000 |
Source: Public Records
Tax History
| Year | Tax Paid | Tax Assessment Tax Assessment Total Assessment is a certain percentage of the fair market value that is determined by local assessors to be the total taxable value of land and additions on the property. | Land | Improvement |
|---|---|---|---|---|
| 2025 | $1,789 | $50,734 | $1,947 | $48,787 |
| 2024 | $1,664 | $46,447 | $1,947 | $44,500 |
| 2023 | $1,671 | $44,579 | $1,947 | $42,632 |
| 2022 | $1,163 | $44,001 | $1,947 | $42,054 |
| 2021 | $1,140 | $41,405 | $1,947 | $39,458 |
| 2020 | $1,109 | $41,405 | $1,947 | $39,458 |
| 2019 | $1,118 | $41,405 | $1,947 | $39,458 |
| 2018 | $1,141 | $40,714 | $3,114 | $37,600 |
| 2017 | $1,653 | $40,714 | $3,114 | $37,600 |
| 2016 | $1,145 | $40,714 | $3,114 | $37,600 |
| 2015 | -- | $40,714 | $3,114 | $37,600 |
| 2014 | -- | $40,714 | $3,114 | $37,600 |
| 2013 | -- | $40,714 | $3,114 | $37,600 |
Source: Public Records
Map
Nearby Homes
Your Personal Tour Guide
Ask me questions while you tour the home.