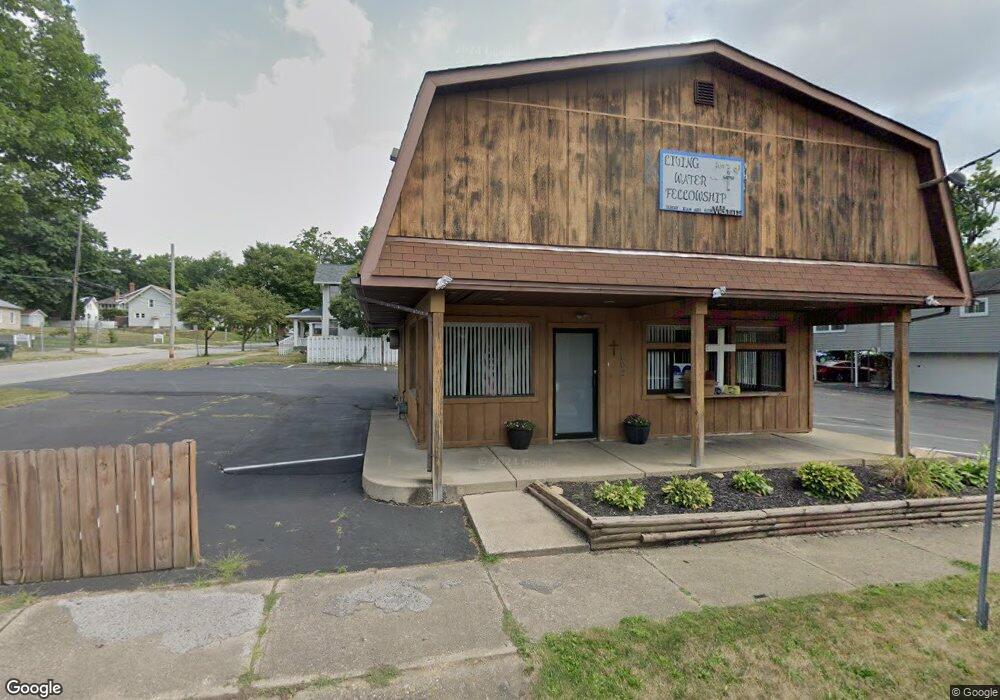
602 E Bowman St Wooster, OH 44691
Estimated Value: $117,917
Studio
--
Bath
1,624
Sq Ft
$73/Sq Ft
Est. Value
About This Home
This home is located at 602 E Bowman St, Wooster, OH 44691 and is currently estimated at $117,917, approximately $72 per square foot. 602 E Bowman St is a home located in Wayne County with nearby schools including Cornerstone Elementary School, Edgewood Middle School, and Wooster High School.
Ownership History
Date
Name
Owned For
Owner Type
Purchase Details
Closed on
Sep 8, 2020
Sold by
Defibaugh Properties Llc
Bought by
C & D Defibaugh Properties Llc
Current Estimated Value
Purchase Details
Closed on
Sep 9, 2018
Sold by
Defibaugh Bret A and Defibaugh Deborah K
Bought by
Defibaugh Properties Llc
Purchase Details
Closed on
Dec 19, 2016
Sold by
Gochdorf Llc
Bought by
Defibaugh Bret A and Coots Corbett J
Home Financials for this Owner
Home Financials are based on the most recent Mortgage that was taken out on this home.
Original Mortgage
$48,000
Interest Rate
3.57%
Mortgage Type
Future Advance Clause Open End Mortgage
Purchase Details
Closed on
Aug 25, 2014
Sold by
Drake Eric L
Bought by
Gochdorf Llc
Purchase Details
Closed on
Jan 1, 1987
Bought by
Drake Eric L
Create a Home Valuation Report for This Property
The Home Valuation Report is an in-depth analysis detailing your home's value as well as a comparison with similar homes in the area
Home Values in the Area
Average Home Value in this Area
Purchase History
| Date | Buyer | Sale Price | Title Company |
|---|---|---|---|
| C & D Defibaugh Properties Llc | -- | None Available | |
| Defibaugh Properties Llc | -- | None Available | |
| Defibaugh Bret A | $65,000 | None Available | |
| Gochdorf Llc | $57,000 | Wayne County Title | |
| Drake Eric L | -- | -- |
Source: Public Records
Mortgage History
| Date | Status | Borrower | Loan Amount |
|---|---|---|---|
| Previous Owner | Defibaugh Bret A | $48,000 |
Source: Public Records
Tax History
| Year | Tax Paid | Tax Assessment Tax Assessment Total Assessment is a certain percentage of the fair market value that is determined by local assessors to be the total taxable value of land and additions on the property. | Land | Improvement |
|---|---|---|---|---|
| 2024 | $2,454 | $33,480 | $12,250 | $21,230 |
| 2023 | $2,453 | $33,480 | $12,250 | $21,230 |
| 2022 | $2,472 | $33,480 | $12,250 | $21,230 |
| 2021 | $2,500 | $33,480 | $12,250 | $21,230 |
| 2020 | $2,343 | $33,480 | $12,250 | $21,230 |
| 2019 | $1,977 | $26,110 | $8,400 | $17,710 |
| 2018 | $1,968 | $26,110 | $8,400 | $17,710 |
| 2017 | $1,962 | $26,110 | $8,400 | $17,710 |
| 2016 | $2,062 | $26,110 | $8,400 | $17,710 |
| 2015 | $2,028 | $26,110 | $8,400 | $17,710 |
| 2013 | $2,044 | $26,590 | $7,700 | $18,890 |
Source: Public Records
Map
Nearby Homes
- 331 Derr Ave
- 920 Washington St
- 938 Washington St
- 708 N Bever St
- 814 N Bever St
- 534 N Buckeye St
- 423 N Market St
- 606 E Henry St
- 1045 Pittsburgh Ave
- 227 N Walnut St
- 1117 Quinby Ave
- 230 Clark Ave
- 851 Park Blvd
- 318 S Grant St
- 1575 Bellevue Dr
- 140 Ohio St
- 1552 Renwood Dr
- 2630 Bauman Dr
- 758 Western Dr
- 5 E Melrose Unit 5
Your Personal Tour Guide
Ask me questions while you tour the home.