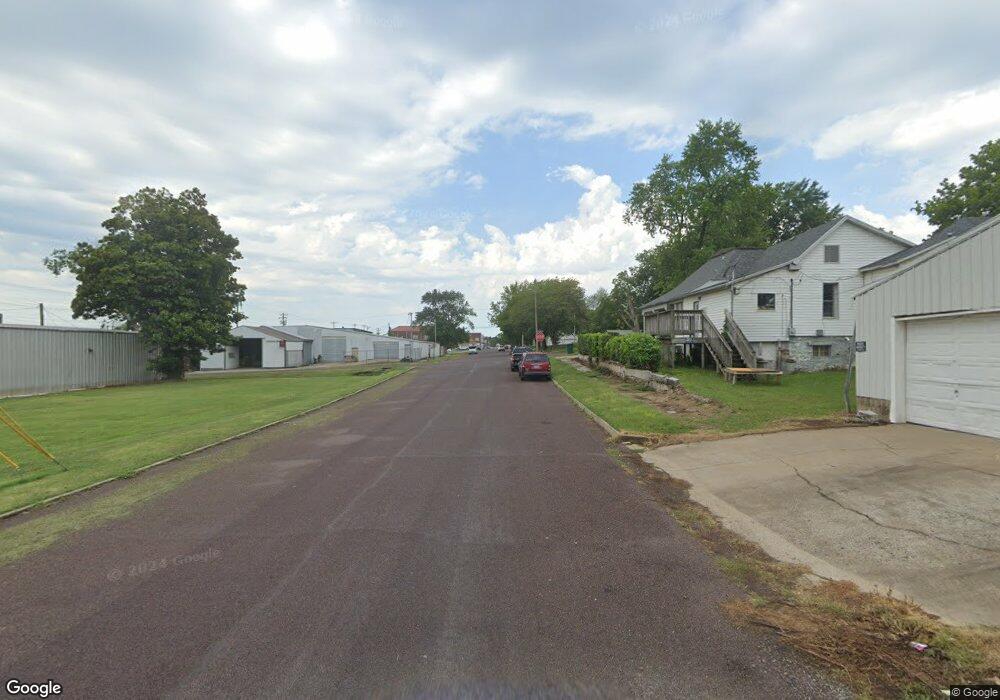
602 E East Bond St Monett, MO 65708
Estimated Value: $203,000 - $229,000
3
Beds
2
Baths
1,780
Sq Ft
$119/Sq Ft
Est. Value
About This Home
This home is located at 602 E East Bond St, Monett, MO 65708 and is currently estimated at $211,494, approximately $118 per square foot. 602 E East Bond St is a home located in Barry County with nearby schools including Monett Elementary School, Monett Intermediate School, and Central Park Elementary School.
Ownership History
Date
Name
Owned For
Owner Type
Purchase Details
Closed on
Dec 18, 2025
Sold by
Markmflips Llc
Bought by
Heieren Etta
Current Estimated Value
Home Financials for this Owner
Home Financials are based on the most recent Mortgage that was taken out on this home.
Original Mortgage
$160,256
Outstanding Balance
$160,256
Interest Rate
6.22%
Mortgage Type
FHA
Estimated Equity
$51,238
Purchase Details
Closed on
Jul 22, 2025
Sold by
Millsap & Singer Pc
Bought by
Markmflips Llc
Purchase Details
Closed on
Mar 16, 2023
Sold by
Gulliford Donna and Gulliford Mark
Bought by
Gomez Erick Medina
Home Financials for this Owner
Home Financials are based on the most recent Mortgage that was taken out on this home.
Original Mortgage
$196,377
Interest Rate
6.09%
Mortgage Type
FHA
Purchase Details
Closed on
Aug 6, 2020
Sold by
U S Bank National Association
Bought by
Gulliford Donna
Purchase Details
Closed on
Jun 18, 2019
Sold by
Golubski James J and Golubski Vickie L
Bought by
Us Bank National Association Nd
Purchase Details
Closed on
Feb 19, 2008
Sold by
Golubski Vickie Lynn
Bought by
Golubski James J
Create a Home Valuation Report for This Property
The Home Valuation Report is an in-depth analysis detailing your home's value as well as a comparison with similar homes in the area
Home Values in the Area
Average Home Value in this Area
Purchase History
We collect this data history from publicly available records. To have your information removed, we recommend requesting removal directly through your county’s website.
| Date | Buyer | Sale Price | Title Company |
|---|---|---|---|
| Heieren Etta | -- | Titan Title | |
| Markmflips Llc | -- | Titan Title | |
| Gomez Erick Medina | -- | Great American Title | |
| Gulliford Donna | -- | Premium Title Svcs Mo Inc | |
| Us Bank National Association Nd | $47,339 | None Available | |
| Golubski James J | -- | None Available |
Source: Public Records
Mortgage History
We collect this data history from publicly available records. To have your information removed, we recommend requesting removal directly through your county’s website.
| Date | Status | Borrower | Loan Amount |
|---|---|---|---|
| Open | Heieren Etta | $160,256 | |
| Previous Owner | Gomez Erick Medina | $196,377 |
Source: Public Records
Tax History
| Year | Tax Paid | Tax Assessment Tax Assessment Total Assessment is a certain percentage of the fair market value that is determined by local assessors to be the total taxable value of land and additions on the property. | Land | Improvement |
|---|---|---|---|---|
| 2025 | $1,976 | $43,681 | $931 | $42,750 |
| 2024 | $1,798 | $39,786 | $931 | $38,855 |
| 2023 | $1,796 | $39,786 | $931 | $38,855 |
| 2022 | $289 | $6,422 | $741 | $5,681 |
| 2020 | $582 | $12,540 | $741 | $11,799 |
| 2019 | $533 | $12,540 | $741 | $11,799 |
| 2018 | $545 | $12,540 | $741 | $11,799 |
| 2017 | $544 | $12,540 | $741 | $11,799 |
| 2016 | $561 | $12,423 | $867 | $11,556 |
| 2015 | -- | $12,423 | $867 | $11,556 |
| 2014 | -- | $12,423 | $867 | $11,556 |
| 2012 | -- | $0 | $0 | $0 |
Source: Public Records
Map
Nearby Homes
Your Personal Tour Guide
Ask me questions while you tour the home.