602 E Logan St Calvert, TX 77837
Estimated Value: $286,000 - $301,000
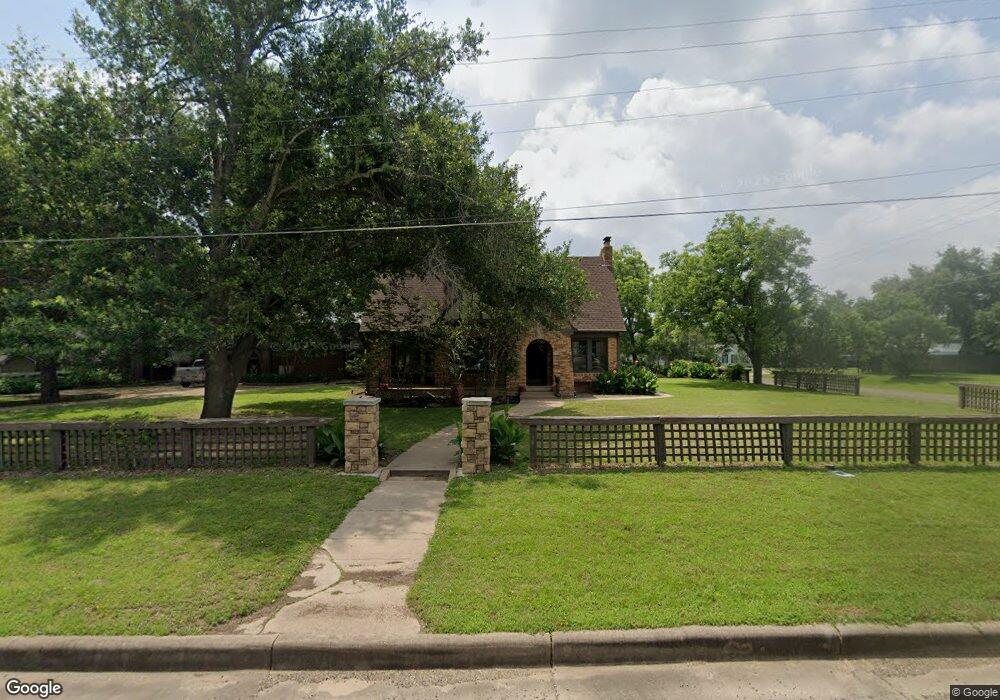
About This Home
This home is located at 602 E Logan St, Calvert, TX 77837 and is currently estimated at $292,344, approximately $170 per square foot. 602 E Logan St is a home located in Robertson County with nearby schools including Calvert School.
Ownership History
We collect this data history from publicly available records. To have your information removed, we recommend requesting removal directly through your county’s website.
Purchase Details
Home Financials for this Owner
Home Financials are based on the most recent Mortgage that was taken out on this home.Purchase History
We collect this data history from publicly available records. To have your information removed, we recommend requesting removal directly through your county’s website.
| Date | Buyer | Sale Price | Title Company |
|---|---|---|---|
| -- | None Available |
Mortgage History
We collect this data history from publicly available records. To have your information removed, we recommend requesting removal directly through your county’s website.
| Date | Status | Borrower | Loan Amount |
|---|---|---|---|
| Open | $103,000 |
Tax History
We collect this data history from publicly available records. To have your information removed, we recommend requesting removal directly through your county’s website.
| Year | Tax Paid | Tax Assessment Tax Assessment Total Assessment is a certain percentage of the fair market value that is determined by local assessors to be the total taxable value of land and additions on the property. | Land | Improvement |
|---|---|---|---|---|
| 2025 | $1,075 | $317,083 | $21,528 | $295,555 |
| 2024 | $44 | $317,083 | $21,528 | $295,555 |
| 2023 | $4,024 | $280,648 | $24,840 | $255,808 |
| 2022 | $4,138 | $229,642 | $7,200 | $222,442 |
| 2021 | $3,503 | $184,750 | $6,480 | $178,270 |
| 2020 | $3,396 | $162,566 | $6,480 | $156,086 |
| 2019 | $3,719 | $171,751 | $5,760 | $165,991 |
| 2018 | $3,757 | $171,751 | $5,760 | $165,991 |
| 2017 | $3,811 | $173,850 | $5,760 | $168,090 |
| 2016 | $3,465 | $155,362 | $5,760 | $149,602 |
| 2015 | -- | $155,362 | $5,760 | $149,602 |
| 2014 | -- | $166,598 | $5,760 | $160,838 |
Map
- 507 E Logan St
- 608 E Barton St
- 506 Maple St
- 0 Highway 6
- 411 Hickory St
- 1100 Maple St
- 0 W Barton
- 502 S Main
- 703/705 S Main
- 706 Mesquite St
- TBD S Hickory Loop
- 109 Cottonwood St
- 1111 Luu Rd
- 0000 Fm 1644
- 0 Hwy 6 S Unit 24045233
- 10570 N State Highway 6
- SH6 State Highway 6 and Cooper Ln
- 11459 Winstead Ln
- 11733 Winstead Ln
- 212 AC Black Bridge Rd
Ask me questions while you tour the home.