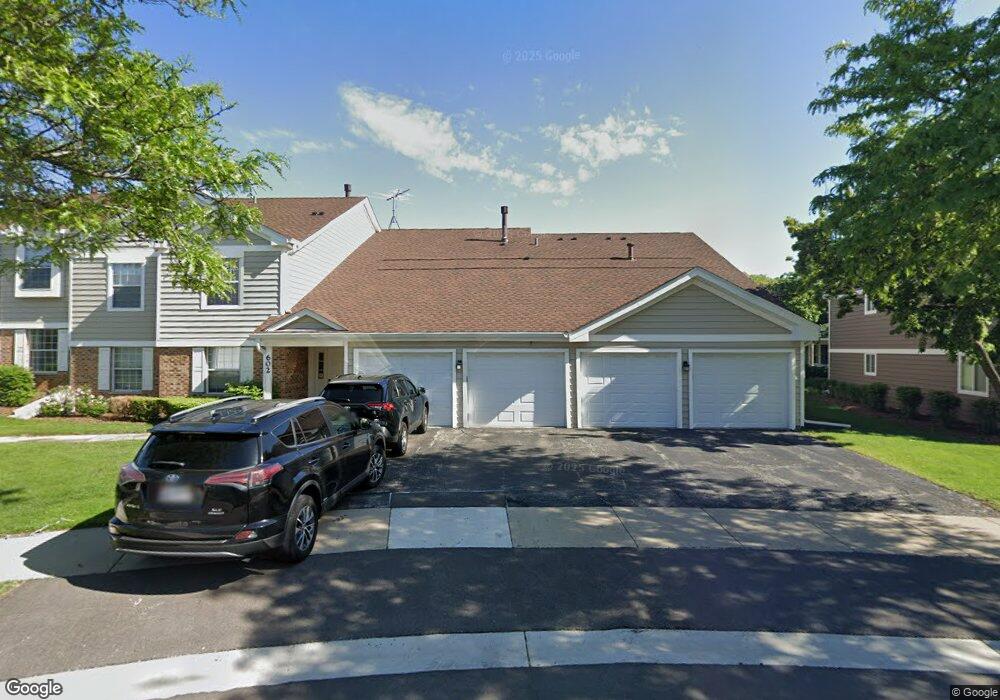
602 Eastview Ct Unit 1168R Schaumburg, IL 60194
East Schaumburg NeighborhoodEstimated Value: $261,000 - $318,000
2
Beds
--
Bath
1,200
Sq Ft
$240/Sq Ft
Est. Value
About This Home
This home is located at 602 Eastview Ct Unit 1168R, Schaumburg, IL 60194 and is currently estimated at $287,930, approximately $239 per square foot. 602 Eastview Ct Unit 1168R is a home located in Cook County with nearby schools including Everett Dirksen Elementary School, Robert Frost Junior High School, and J B Conant High School.
Ownership History
Date
Name
Owned For
Owner Type
Purchase Details
Closed on
Jun 28, 2019
Sold by
Gallery Russell and Berince I Gallery Revocable Tr
Bought by
Koziol Andrzej and Rygula Koziol Renata A
Current Estimated Value
Home Financials for this Owner
Home Financials are based on the most recent Mortgage that was taken out on this home.
Original Mortgage
$124,125
Outstanding Balance
$82,928
Interest Rate
4.5%
Mortgage Type
New Conventional
Estimated Equity
$205,002
Purchase Details
Closed on
Feb 19, 2010
Sold by
Gallery Berenice I and Gallery Winton T
Bought by
Gallery Berenice I and Berenice I Gallery Revocable T
Purchase Details
Closed on
Nov 30, 1994
Sold by
Wisner Doris Loreen and Doris Loreen Wisner Trust
Bought by
Gallery John W and Gallery Berenice I
Home Financials for this Owner
Home Financials are based on the most recent Mortgage that was taken out on this home.
Original Mortgage
$40,000
Interest Rate
7%
Create a Home Valuation Report for This Property
The Home Valuation Report is an in-depth analysis detailing your home's value as well as a comparison with similar homes in the area
Home Values in the Area
Average Home Value in this Area
Purchase History
| Date | Buyer | Sale Price | Title Company |
|---|---|---|---|
| Koziol Andrzej | $165,500 | Attorneys Ttl Guaranty Fund | |
| Gallery Berenice I | -- | None Available | |
| Gallery John W | $104,000 | -- |
Source: Public Records
Mortgage History
| Date | Status | Borrower | Loan Amount |
|---|---|---|---|
| Open | Koziol Andrzej | $124,125 | |
| Previous Owner | Gallery John W | $40,000 |
Source: Public Records
Tax History Compared to Growth
Tax History
| Year | Tax Paid | Tax Assessment Tax Assessment Total Assessment is a certain percentage of the fair market value that is determined by local assessors to be the total taxable value of land and additions on the property. | Land | Improvement |
|---|---|---|---|---|
| 2024 | $5,017 | $17,910 | $5,507 | $12,403 |
| 2023 | $4,865 | $17,910 | $5,507 | $12,403 |
| 2022 | $4,865 | $17,910 | $5,507 | $12,403 |
| 2021 | $4,405 | $14,532 | $7,056 | $7,476 |
| 2020 | $4,329 | $14,532 | $7,056 | $7,476 |
| 2019 | $4,330 | $16,156 | $7,056 | $9,100 |
| 2018 | $3,561 | $11,865 | $5,937 | $5,928 |
| 2017 | $3,505 | $11,865 | $5,937 | $5,928 |
| 2016 | $3,277 | $11,865 | $5,937 | $5,928 |
| 2015 | $3,648 | $12,193 | $5,163 | $7,030 |
| 2014 | $3,608 | $12,193 | $5,163 | $7,030 |
| 2013 | $3,515 | $12,193 | $5,163 | $7,030 |
Source: Public Records
Map
Nearby Homes
- 602 Eastview Ct Unit Z1
- 600 Eastview Ct Unit X1
- 601 Hanover Ct Unit Z2
- 121 Chatsworth Cir
- 22 Ascot Cir
- 28 Ascot Cir
- 325 Bayview Point Unit 56B
- 751 Edgelake Point Unit 68C
- 350 Newgate Ct Unit 2Z
- 91 Lambert Dr Unit B1
- 287 Pembridge Ln Unit B2
- 22 Waterbury Ln Unit N1
- 125 Cleveland Ct Unit M2
- 147 Fulbright Ln
- 1871 Fox Run Dr Unit A
- 153 Fulbright Ln
- 421 Summit Dr
- 802 Stonewall Ct Unit 55
- 465 Apache Ln
- 15 Bar Harbour Rd Unit 4F
- 602 Eastview Ct Unit 1168R
- 602 Eastview Ct Unit 1168R
- 602 Eastview Ct Unit 1168R
- 602 Eastview Ct Unit V2
- 602 Eastview Ct Unit Z2
- 602 Eastview Ct Unit V1
- 600 Eastview Ct Unit 1168L
- 600 Eastview Ct Unit 1168L
- 600 Eastview Ct Unit 1168L
- 600 Eastview Ct Unit 1168L
- 600 Eastview Ct Unit W1
- 607 Berkley Ct Unit V1
- 607 Berkley Ct Unit 1110R
- 607 Berkley Ct Unit 1110R
- 607 Berkley Ct Unit 1110R
- 607 Berkley Ct Unit 1110R
- 607 Berkley Ct Unit V2
- 606 Eastview Ct Unit Z2
- 606 Eastview Ct Unit 1149R
- 606 Eastview Ct Unit 1149R