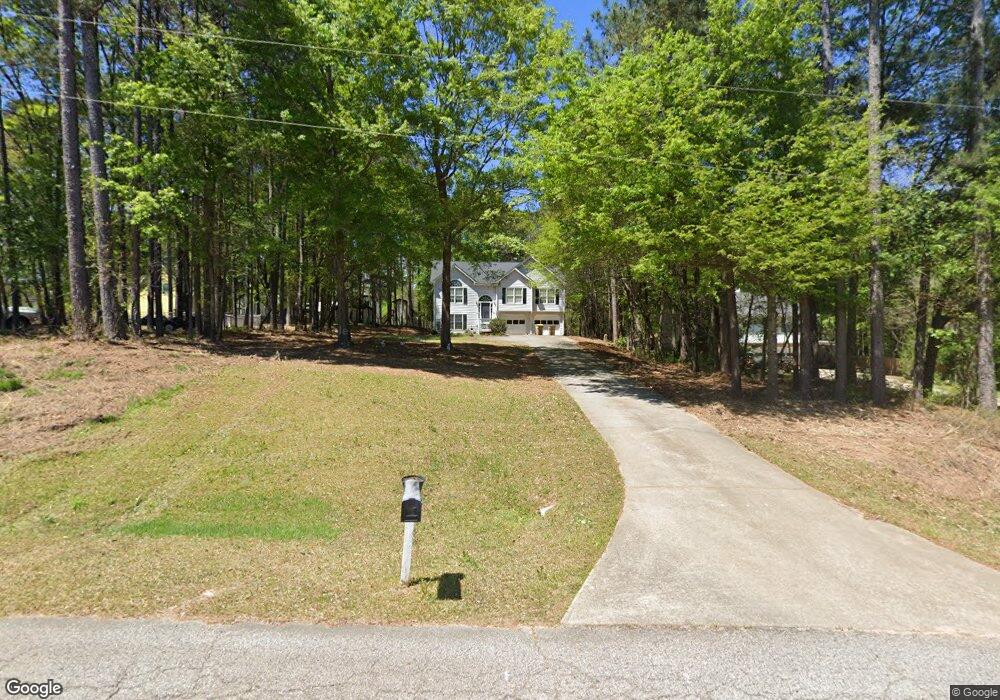
602 Evergreen Rd Winder, GA 30680
Estimated Value: $333,031 - $363,000
--
Bed
3
Baths
1,738
Sq Ft
$199/Sq Ft
Est. Value
About This Home
This home is located at 602 Evergreen Rd, Winder, GA 30680 and is currently estimated at $345,008, approximately $198 per square foot. 602 Evergreen Rd is a home located in Barrow County with nearby schools including Yargo Elementary School, Haymon-Morris Middle School, and Apalachee High School.
Ownership History
Date
Name
Owned For
Owner Type
Purchase Details
Closed on
Jan 5, 2006
Sold by
Hawkins Cathryn F
Bought by
Fuller Cathy D
Current Estimated Value
Purchase Details
Closed on
Jan 17, 2003
Sold by
Fuller Cathy Denise
Bought by
Fuller Cathy Denise And
Home Financials for this Owner
Home Financials are based on the most recent Mortgage that was taken out on this home.
Original Mortgage
$53,000
Interest Rate
5.98%
Mortgage Type
Stand Alone Second
Purchase Details
Closed on
Sep 29, 1998
Sold by
Fuller Anthony M And
Bought by
Fuller Cathy Denise
Purchase Details
Closed on
Apr 30, 1997
Sold by
Camp Terry
Bought by
Fuller Anthony M and Fuller Cathy D
Home Financials for this Owner
Home Financials are based on the most recent Mortgage that was taken out on this home.
Original Mortgage
$54,900
Interest Rate
8.2%
Mortgage Type
New Conventional
Purchase Details
Closed on
Mar 26, 1993
Bought by
Catpau Enterprises I
Create a Home Valuation Report for This Property
The Home Valuation Report is an in-depth analysis detailing your home's value as well as a comparison with similar homes in the area
Home Values in the Area
Average Home Value in this Area
Purchase History
| Date | Buyer | Sale Price | Title Company |
|---|---|---|---|
| Fuller Cathy D | -- | -- | |
| Fuller Cathy Denise And | -- | -- | |
| Fuller Cathy Denise | -- | -- | |
| Fuller Anthony M | $109,900 | -- | |
| Catpau Enterprises I | -- | -- |
Source: Public Records
Mortgage History
| Date | Status | Borrower | Loan Amount |
|---|---|---|---|
| Previous Owner | Fuller Cathy Denise And | $53,000 | |
| Previous Owner | Fuller Anthony M | $54,900 |
Source: Public Records
Tax History Compared to Growth
Tax History
| Year | Tax Paid | Tax Assessment Tax Assessment Total Assessment is a certain percentage of the fair market value that is determined by local assessors to be the total taxable value of land and additions on the property. | Land | Improvement |
|---|---|---|---|---|
| 2024 | $2,118 | $97,506 | $21,600 | $75,906 |
| 2023 | $1,703 | $97,906 | $21,600 | $76,306 |
| 2022 | $2,262 | $90,636 | $21,600 | $69,036 |
| 2021 | $1,929 | $72,167 | $16,000 | $56,167 |
| 2020 | $1,922 | $72,167 | $16,000 | $56,167 |
| 2019 | $1,752 | $63,694 | $16,000 | $47,694 |
| 2018 | $1,532 | $55,395 | $12,000 | $43,395 |
| 2017 | $1,198 | $41,148 | $12,000 | $29,148 |
| 2016 | $1,156 | $41,504 | $12,000 | $29,504 |
| 2015 | $1,172 | $41,858 | $12,000 | $29,858 |
| 2014 | $1,041 | $37,330 | $6,762 | $30,568 |
| 2013 | -- | $37,390 | $6,762 | $30,628 |
Source: Public Records
Map
Nearby Homes
- 721 Loblolly Ln
- 32 Livingston Ct
- 138 Livingston Ct
- 38 Holland Cove
- 37 Holland Cove
- 47 Holland Cove
- 50 Holland Cove
- 57 Holland Cove
- 62 Holland Cove
- 79 Holland Cove
- 86 Holland Cove
- 89 Holland Cove
- Brandon Plan at Willowbrook
- ANSLEY Express Plan at Willowbrook
- HAYDEN Express Plan at Willowbrook
- ARIA Express Plan at Willowbrook
- Rachel Plan at Willowbrook
- 921 Roxeywood Dr
- 1185 Wendy Way
- 1411 Silvergate Way
- 604 Evergreen Rd Unit I
- 600 Evergreen Rd
- 702 Evergreen Rd
- 788 Evergreen Rd
- 674 Tom Miller Rd Unit 1
- 642 Evergreen Rd
- 652 Evergreen Rd
- 671 Evergreen Rd
- 647 Evergreen Rd
- 683 Evergreen Rd
- 659 Evergreen Rd
- 621 Evergreen Rd
- 664 Tom Miller Rd Unit 1
- 700 Evergreen Dr Unit 2
- 701 Evergreen Dr
- 622 Evergreen Rd
- 42 Fir Ln
- 896 Evergreen Rd
- 721 Evergreen Rd
- 606 Evergreen Rd