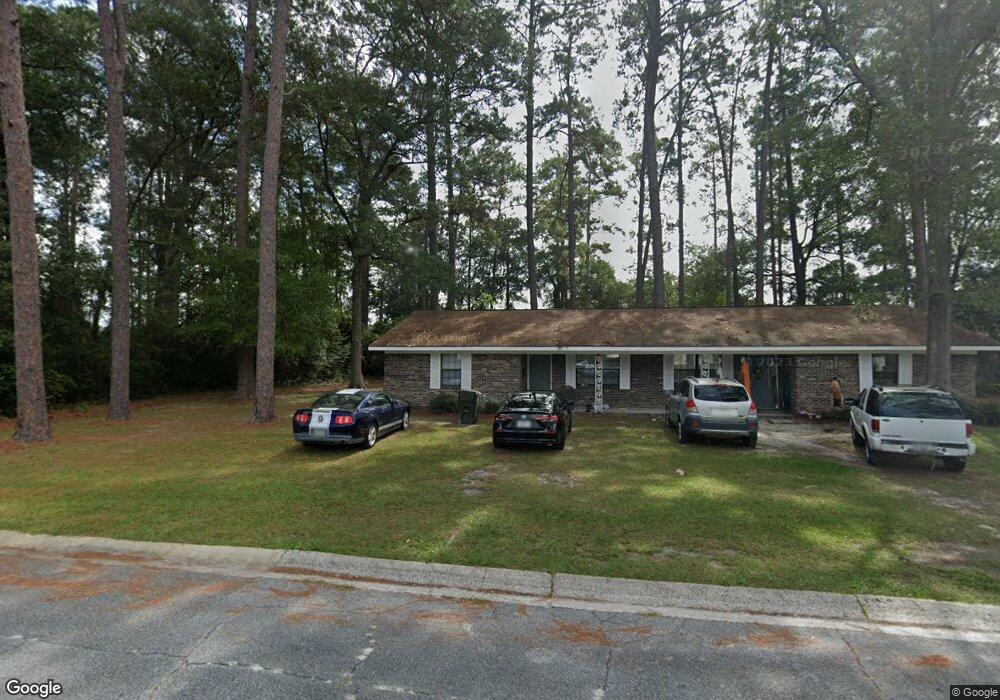
602 Fern St Waycross, GA 31501
Estimated Value: $154,000 - $204,385
2
Beds
1
Bath
1,980
Sq Ft
$92/Sq Ft
Est. Value
About This Home
This home is located at 602 Fern St, Waycross, GA 31501 and is currently estimated at $182,096, approximately $91 per square foot. 602 Fern St is a home located in Ware County with nearby schools including Williams Heights Elementary School, Waycross Middle School, and Ware County High School.
Ownership History
Date
Name
Owned For
Owner Type
Purchase Details
Closed on
Aug 8, 2022
Sold by
R J Welch & Son Inc
Bought by
L J Welch & Associates Inc
Current Estimated Value
Purchase Details
Closed on
Nov 19, 2010
Sold by
Bennett Lewis Wendel
Bought by
R J Welch & Son Inc
Purchase Details
Closed on
Apr 9, 2009
Sold by
Bennett Amy
Bought by
Bennett Lewis Windel
Purchase Details
Closed on
Jun 10, 2003
Sold by
Richmond Commercial Investment
Bought by
Bennett Lewis Windel and Bennett Amy
Purchase Details
Closed on
Feb 21, 2003
Sold by
Waycross Properties
Bought by
Richmond Commercial Investments Inc
Purchase Details
Closed on
Jun 1, 2000
Sold by
Richmond Commercial
Bought by
Waycross Properties
Purchase Details
Closed on
Dec 31, 1987
Purchase Details
Closed on
Mar 28, 1986
Purchase Details
Closed on
Jul 22, 1985
Create a Home Valuation Report for This Property
The Home Valuation Report is an in-depth analysis detailing your home's value as well as a comparison with similar homes in the area
Home Values in the Area
Average Home Value in this Area
Purchase History
| Date | Buyer | Sale Price | Title Company |
|---|---|---|---|
| L J Welch & Associates Inc | -- | -- | |
| R J Welch & Son Inc | $100,000 | -- | |
| Bennett Lewis Windel | -- | -- | |
| Bennett Lewis Windel | $75,000 | -- | |
| Richmond Commercial Investments Inc | -- | -- | |
| Waycross Properties | -- | -- | |
| -- | $62,000 | -- | |
| -- | $62,000 | -- | |
| -- | $57,800 | -- |
Source: Public Records
Tax History Compared to Growth
Tax History
| Year | Tax Paid | Tax Assessment Tax Assessment Total Assessment is a certain percentage of the fair market value that is determined by local assessors to be the total taxable value of land and additions on the property. | Land | Improvement |
|---|---|---|---|---|
| 2024 | $2,414 | $72,302 | $8,000 | $64,302 |
| 2023 | $2,493 | $48,090 | $3,629 | $44,461 |
| 2022 | $1,916 | $48,090 | $3,629 | $44,461 |
| 2021 | $1,725 | $39,896 | $3,629 | $36,267 |
| 2020 | $1,509 | $34,621 | $3,629 | $30,992 |
| 2019 | $1,482 | $33,522 | $3,629 | $29,893 |
| 2018 | $1,447 | $32,423 | $3,629 | $28,794 |
| 2017 | $1,414 | $32,423 | $3,629 | $28,794 |
| 2016 | $1,414 | $32,423 | $3,629 | $28,794 |
| 2015 | $1,424 | $32,422 | $3,629 | $28,794 |
| 2014 | $1,422 | $32,423 | $3,629 | $28,794 |
| 2013 | -- | $36,128 | $3,628 | $32,499 |
Source: Public Records
Map
Nearby Homes
- 506 Magnolia Dr
- 808 Satilla Blvd
- 0 Goodwin St
- 511 Richmond Ave
- 1101 Cherokee Dr
- 713 Magnolia Dr
- 924 Highsmith St
- 415 Dewey St
- 502 Dewey St
- 807 College St
- 903 Atlantic Ave
- 0 Saint Marys Dr Unit (TRACT 2 0.25 ACRES)
- 707 Euclid Ave
- 1100 Atlantic Ave
- 7438 Central Ave
- 907 Euclid Ave
- 1205 Dean Dr
- 1405 Grove Ave
- 1701 Satilla Blvd
- 1009 Euclid Ave