Estimated Value: $314,606 - $330,000
3
Beds
2
Baths
1,522
Sq Ft
$213/Sq Ft
Est. Value
About This Home
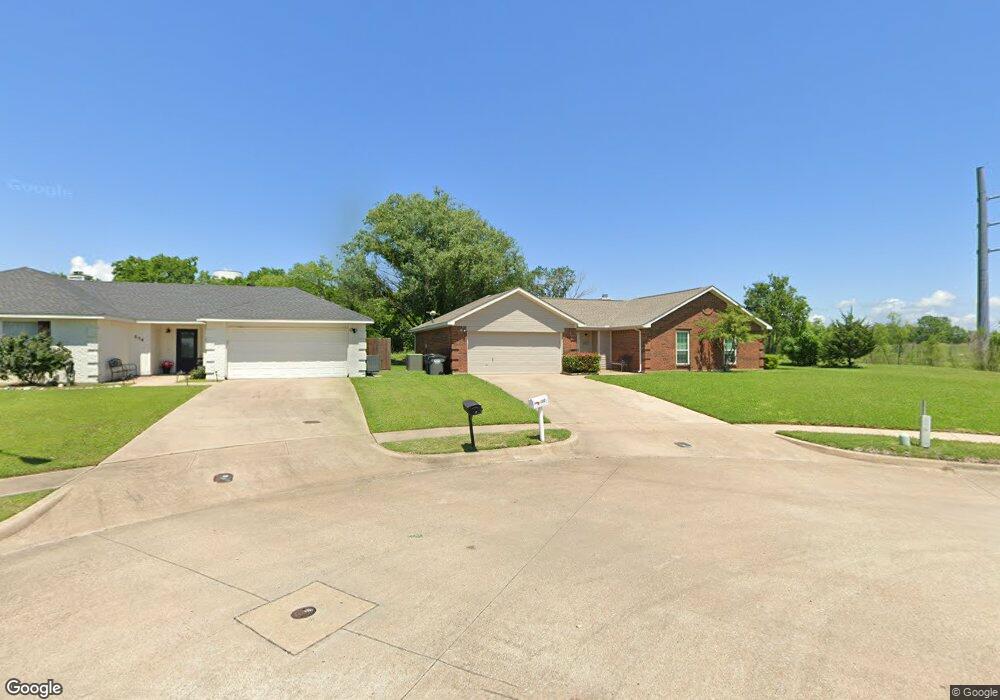
This home is located at 602 Graham Ct, Wylie, TX 75098 and is currently estimated at $324,652, approximately $213 per square foot. 602 Graham Ct is a home located in Collin County with nearby schools including T.F. Birmingham Elementary School, Frank Mcmillan Junior High School, and Davis Intermediate School.
Ownership History
Date
Name
Owned For
Owner Type
Purchase Details
Closed on
May 22, 2019
Sold by
Brown Jennifer Louise and Brown Jennifer L
Bought by
Brown Thomas Albert and Brown Thomas A
Current Estimated Value
Purchase Details
Closed on
May 22, 1998
Sold by
Miller Martye L Sherman and Miller Mark W
Bought by
Brown Thomas A and Brown Jennifer L
Home Financials for this Owner
Home Financials are based on the most recent Mortgage that was taken out on this home.
Original Mortgage
$90,550
Outstanding Balance
$17,878
Interest Rate
7.22%
Mortgage Type
FHA
Estimated Equity
$306,774
Purchase Details
Closed on
Mar 28, 1994
Sold by
Carriage Custom Homes Inc
Bought by
Sherman Martye L
Home Financials for this Owner
Home Financials are based on the most recent Mortgage that was taken out on this home.
Original Mortgage
$80,494
Interest Rate
7.31%
Mortgage Type
FHA
Create a Home Valuation Report for This Property
The Home Valuation Report is an in-depth analysis detailing your home's value as well as a comparison with similar homes in the area
Home Values in the Area
Average Home Value in this Area
Purchase History
| Date | Buyer | Sale Price | Title Company |
|---|---|---|---|
| Brown Thomas Albert | -- | Chicago Title | |
| Brown Thomas A | -- | -- | |
| Sherman Martye L | -- | -- |
Source: Public Records
Mortgage History
| Date | Status | Borrower | Loan Amount |
|---|---|---|---|
| Open | Brown Thomas A | $90,550 | |
| Previous Owner | Sherman Martye L | $80,494 |
Source: Public Records
Tax History Compared to Growth
Tax History
| Year | Tax Paid | Tax Assessment Tax Assessment Total Assessment is a certain percentage of the fair market value that is determined by local assessors to be the total taxable value of land and additions on the property. | Land | Improvement |
|---|---|---|---|---|
| 2025 | $4,657 | $316,711 | $89,250 | $227,461 |
| 2024 | $4,657 | $300,897 | $89,250 | $231,044 |
| 2023 | $4,657 | $273,543 | $89,250 | $238,049 |
| 2022 | $5,456 | $248,675 | $73,500 | $227,711 |
| 2021 | $5,319 | $226,068 | $73,500 | $152,568 |
| 2020 | $5,171 | $208,243 | $57,750 | $150,493 |
| 2019 | $5,366 | $204,196 | $57,750 | $152,950 |
| 2018 | $4,999 | $185,633 | $57,750 | $140,926 |
| 2017 | $4,545 | $179,618 | $52,500 | $127,118 |
| 2016 | $4,263 | $158,684 | $36,750 | $121,934 |
| 2015 | $3,351 | $139,468 | $30,000 | $109,468 |
Source: Public Records
Map
Nearby Homes
- 605 Graham Ct
- 517 E Gaston Dr
- 502 E Gaston Dr
- 423 N Winding Oaks Dr
- 514 Brighton Ct
- 705 Baldwin Rd
- 410 N Winding Oaks Dr
- 410 Oxford Dr
- 713 Kinston Ct
- 1312 Meziere Sky Dr
- 550 Parker Rd
- 415 Carver Dr
- 500 Parker Rd
- 626 Gunters Mountain Ln
- 907 Carlton Rd
- 902 Greene Way
- 309 Sikorsky Ct
- 913 Chickesaw Ln
- 908 Greene Way
- 307 W Brown St
- 604 Graham Ct
- 603 Graham Ct
- 520 E Gaston Dr
- 518 E Gaston Dr
- 600 Graham Ct
- 601 Graham Ct
- 616 Marbury Way
- 614 Marbury Way
- 516 E Gaston Dr
- 618 Marbury Way
- 515 N Gaston Dr
- 612 Marbury Way
- 514 E Gaston Dr
- 513 N Gaston Dr
- 702 Lone Star Ct
- 610 Marbury Way
- 511 N Gaston Dr
- 512 E Gaston Dr
- 704 Lone Star Ct
- 700 Lone Star Ct