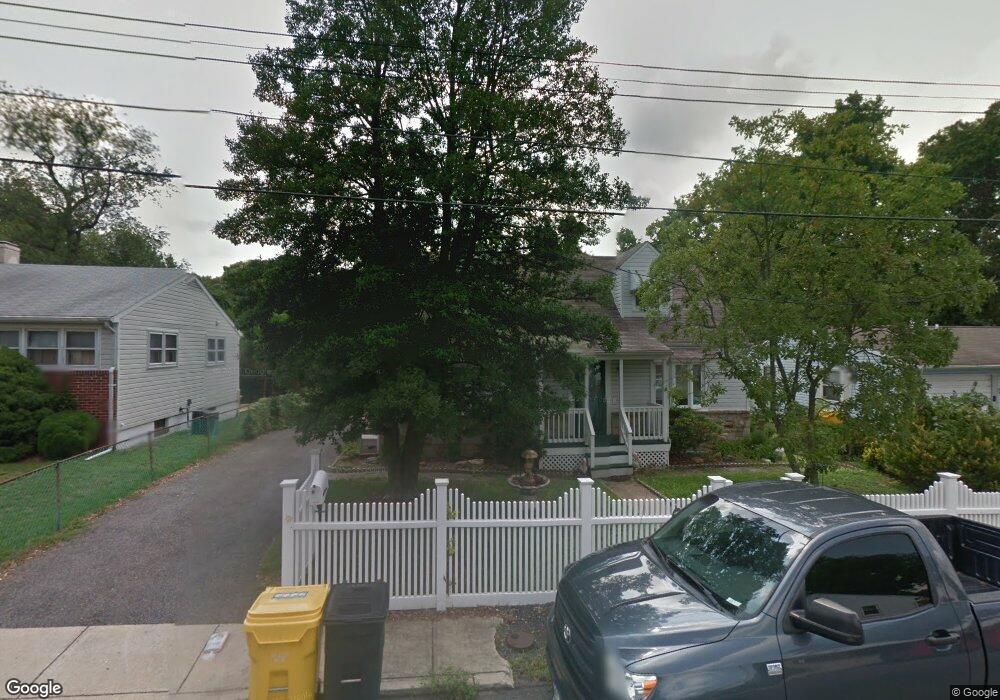
602 Kuethe Rd NE Glen Burnie, MD 21060
Estimated Value: $366,000 - $389,382
--
Bed
2
Baths
1,296
Sq Ft
$293/Sq Ft
Est. Value
About This Home
This home is located at 602 Kuethe Rd NE, Glen Burnie, MD 21060 and is currently estimated at $379,096, approximately $292 per square foot. 602 Kuethe Rd NE is a home located in Anne Arundel County with nearby schools including Point Pleasant Elementary School, Marley Middle School, and Glen Burnie High School.
Ownership History
Date
Name
Owned For
Owner Type
Purchase Details
Closed on
Nov 11, 2024
Sold by
Dill Dawnella Sue and Dill John Travis
Bought by
Dawnella Sue Dill & John Travis Dill Revocabl
Current Estimated Value
Purchase Details
Closed on
Dec 27, 2006
Sold by
Marshall Norwood V
Bought by
Dill John T and Dill Dawnella S
Home Financials for this Owner
Home Financials are based on the most recent Mortgage that was taken out on this home.
Original Mortgage
$58,000
Interest Rate
6.36%
Mortgage Type
Purchase Money Mortgage
Purchase Details
Closed on
Nov 20, 2006
Sold by
Marshall Norwood V
Bought by
Dill John T and Dill Dawnella S
Home Financials for this Owner
Home Financials are based on the most recent Mortgage that was taken out on this home.
Original Mortgage
$58,000
Interest Rate
6.36%
Mortgage Type
Purchase Money Mortgage
Create a Home Valuation Report for This Property
The Home Valuation Report is an in-depth analysis detailing your home's value as well as a comparison with similar homes in the area
Home Values in the Area
Average Home Value in this Area
Purchase History
| Date | Buyer | Sale Price | Title Company |
|---|---|---|---|
| Dawnella Sue Dill & John Travis Dill Revocabl | -- | None Listed On Document | |
| Dawnella Sue Dill & John Travis Dill Revocabl | -- | None Listed On Document | |
| Dill John T | $290,000 | -- | |
| Dill John T | $290,000 | -- |
Source: Public Records
Mortgage History
| Date | Status | Borrower | Loan Amount |
|---|---|---|---|
| Previous Owner | Dill John T | $58,000 | |
| Previous Owner | Dill John T | $232,000 | |
| Previous Owner | Dill John T | $232,000 |
Source: Public Records
Tax History Compared to Growth
Tax History
| Year | Tax Paid | Tax Assessment Tax Assessment Total Assessment is a certain percentage of the fair market value that is determined by local assessors to be the total taxable value of land and additions on the property. | Land | Improvement |
|---|---|---|---|---|
| 2025 | $3,119 | $254,700 | $144,500 | $110,200 |
| 2024 | $3,119 | $238,933 | $0 | $0 |
| 2023 | $2,911 | $223,167 | $0 | $0 |
| 2022 | $2,598 | $207,400 | $119,500 | $87,900 |
| 2021 | $2,514 | $199,367 | $0 | $0 |
| 2020 | $2,389 | $191,333 | $0 | $0 |
| 2019 | $2,306 | $183,300 | $97,600 | $85,700 |
| 2018 | $1,851 | $182,500 | $0 | $0 |
| 2017 | $2,235 | $181,700 | $0 | $0 |
| 2016 | -- | $180,900 | $0 | $0 |
| 2015 | -- | $178,000 | $0 | $0 |
| 2014 | -- | $175,100 | $0 | $0 |
Source: Public Records
Map
Nearby Homes
- 204 Carroll Rd
- 454 Renfro Ct
- 281 Thompson Ave E
- 400 Renfro Dr
- 133 Glen Rd
- 0 Ritchie Hwy
- 330 New Jersey Ave NE
- 115 Dorchester Rd
- 102 Garrett Rd
- 102 Kuethe Rd NE
- 102 Kent Rd
- 101 Kuethe Rd NE
- 933 Andrews Rd
- 210 Hollywood Ct
- 202 Hollywood Ct
- 136 Margate Dr
- 108 New Jersey Ave NW
- 105 New Jersey Ave NW
- 36 Elm Dr
- 900 Princeton Terrace
- 604 Kuethe Rd NE
- 600 Kuethe Rd NE
- 606 Kuethe Rd NE
- 420 6th Ave NE
- 528 Kuethe Rd NE
- 528 Kuethe Rd NE Unit C
- 528 Kuethe Rd NE Unit D
- 528 Kuethe Rd NE Unit E
- 601 Kuethe Rd NE
- 608 Kuethe Rd NE
- 418 6th Ave NE
- 417 7th Ave NE
- 526 Kuethe Rd NE
- 415 7th Ave NE
- 416 6th Ave NE
- 419 6th Ave NE
- 411 6th Ave NE
- 413 7th Ave NE
- 414 6th Ave NE
- 416 7th Ave NE