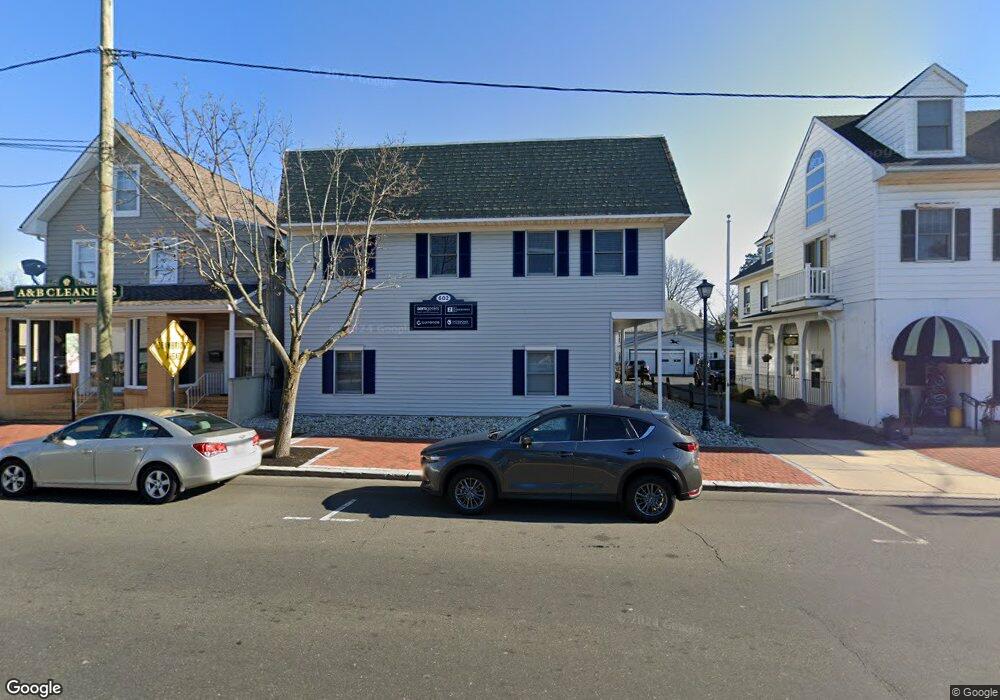
602 Main St Unit Bldg Belmar, NJ 07719
Estimated Value: $1,511,586
--
Bed
--
Bath
6,000
Sq Ft
$252/Sq Ft
Est. Value
About This Home
This home is located at 602 Main St Unit Bldg, Belmar, NJ 07719 and is currently estimated at $1,511,586, approximately $251 per square foot. 602 Main St Unit Bldg is a home located in Monmouth County with nearby schools including Belmar Elementary School.
Ownership History
Date
Name
Owned For
Owner Type
Purchase Details
Closed on
Jul 2, 2015
Sold by
Garruzzo Guiseppe and Garruzzo Caterina
Bought by
Pe 602 Main Llc
Current Estimated Value
Home Financials for this Owner
Home Financials are based on the most recent Mortgage that was taken out on this home.
Original Mortgage
$675,000
Outstanding Balance
$526,693
Interest Rate
3.88%
Mortgage Type
Commercial
Estimated Equity
$984,893
Purchase Details
Closed on
Aug 25, 2005
Sold by
Fore Investors Inc
Bought by
Garruzzo Guiseppe and Garruzzo Caterina
Create a Home Valuation Report for This Property
The Home Valuation Report is an in-depth analysis detailing your home's value as well as a comparison with similar homes in the area
Home Values in the Area
Average Home Value in this Area
Purchase History
| Date | Buyer | Sale Price | Title Company |
|---|---|---|---|
| Pe 602 Main Llc | $750,000 | Red Bank Title Agency Inc | |
| Garruzzo Guiseppe | $815,000 | -- |
Source: Public Records
Mortgage History
| Date | Status | Borrower | Loan Amount |
|---|---|---|---|
| Open | Pe 602 Main Llc | $675,000 |
Source: Public Records
Tax History Compared to Growth
Tax History
| Year | Tax Paid | Tax Assessment Tax Assessment Total Assessment is a certain percentage of the fair market value that is determined by local assessors to be the total taxable value of land and additions on the property. | Land | Improvement |
|---|---|---|---|---|
| 2025 | $10,975 | $754,300 | $292,500 | $461,800 |
| 2024 | $10,605 | $754,300 | $292,500 | $461,800 |
| 2023 | $10,605 | $754,300 | $292,500 | $461,800 |
| 2022 | $10,236 | $754,300 | $292,500 | $461,800 |
| 2021 | $10,236 | $754,300 | $292,500 | $461,800 |
| 2020 | $10,726 | $754,300 | $292,500 | $461,800 |
| 2019 | $10,145 | $754,300 | $292,500 | $461,800 |
| 2018 | $9,316 | $754,300 | $292,500 | $461,800 |
| 2017 | $9,089 | $754,300 | $292,500 | $461,800 |
| 2016 | $9,995 | $523,000 | $153,000 | $370,000 |
| 2015 | $10,123 | $527,500 | $157,500 | $370,000 |
| 2014 | $10,643 | $550,000 | $180,000 | $370,000 |
Source: Public Records
Map
Nearby Homes