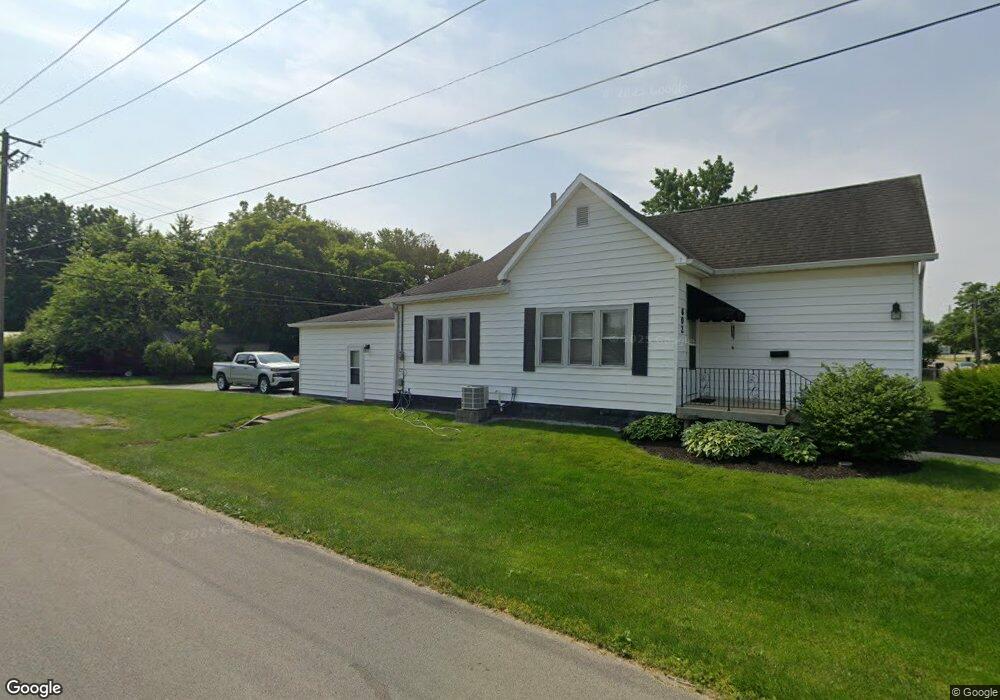
602 Milton Ave Anderson, IN 46012
Estimated Value: $93,000 - $136,618
3
Beds
2
Baths
1,185
Sq Ft
$92/Sq Ft
Est. Value
About This Home
This home is located at 602 Milton Ave, Anderson, IN 46012 and is currently estimated at $108,905, approximately $91 per square foot. 602 Milton Ave is a home located in Madison County with nearby schools including Tenth Street Elementary School, Highland Middle School, and Anderson High School.
Ownership History
Date
Name
Owned For
Owner Type
Purchase Details
Closed on
Aug 29, 2022
Sold by
Luther Bilbrey Kevin and Luther Jan Pamela
Bought by
Tacket Thomas and Tacket Shayne
Current Estimated Value
Home Financials for this Owner
Home Financials are based on the most recent Mortgage that was taken out on this home.
Original Mortgage
$64,125
Outstanding Balance
$61,288
Interest Rate
5.3%
Mortgage Type
New Conventional
Estimated Equity
$47,617
Create a Home Valuation Report for This Property
The Home Valuation Report is an in-depth analysis detailing your home's value as well as a comparison with similar homes in the area
Home Values in the Area
Average Home Value in this Area
Purchase History
| Date | Buyer | Sale Price | Title Company |
|---|---|---|---|
| Tacket Thomas | $67,500 | Diaz Anselmo & Associates Llc |
Source: Public Records
Mortgage History
| Date | Status | Borrower | Loan Amount |
|---|---|---|---|
| Open | Tacket Thomas | $64,125 |
Source: Public Records
Tax History Compared to Growth
Tax History
| Year | Tax Paid | Tax Assessment Tax Assessment Total Assessment is a certain percentage of the fair market value that is determined by local assessors to be the total taxable value of land and additions on the property. | Land | Improvement |
|---|---|---|---|---|
| 2024 | $753 | $71,300 | $6,900 | $64,400 |
| 2023 | $688 | $65,100 | $6,600 | $58,500 |
| 2022 | $636 | $64,700 | $6,200 | $58,500 |
| 2021 | $1,332 | $59,200 | $6,200 | $53,000 |
| 2020 | $1,276 | $56,500 | $5,900 | $50,600 |
| 2019 | $1,244 | $55,000 | $5,900 | $49,100 |
| 2018 | $1,207 | $52,300 | $5,900 | $46,400 |
| 2017 | $1,032 | $51,600 | $5,900 | $45,700 |
| 2016 | $1,048 | $52,400 | $6,100 | $46,300 |
| 2014 | $1,066 | $53,300 | $6,400 | $46,900 |
| 2013 | $1,066 | $53,300 | $6,400 | $46,900 |
Source: Public Records
Map
Nearby Homes