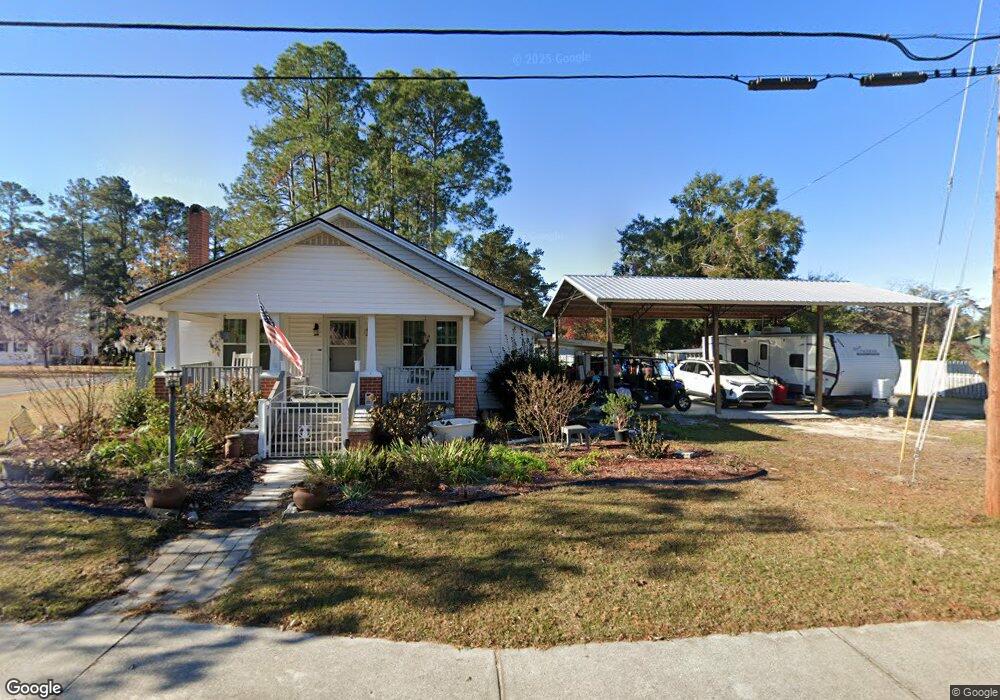
602 N Ash St Springfield, GA 31329
Estimated Value: $226,169 - $280,000
Studio
--
Bath
1,467
Sq Ft
$169/Sq Ft
Est. Value
About This Home
This home is located at 602 N Ash St, Springfield, GA 31329 and is currently estimated at $248,042, approximately $169 per square foot. 602 N Ash St is a home with nearby schools including Springfield Elementary School, Effingham County Middle School, and Effingham County High School.
Ownership History
Date
Name
Owned For
Owner Type
Purchase Details
Closed on
Feb 24, 2020
Sold by
Nelson Donald B
Bought by
Forkner Sue Duke
Current Estimated Value
Home Financials for this Owner
Home Financials are based on the most recent Mortgage that was taken out on this home.
Original Mortgage
$96,000
Interest Rate
3.6%
Mortgage Type
New Conventional
Purchase Details
Closed on
Jan 17, 2020
Sold by
Durrence Jo Ann Seckinger
Bought by
Nelson Donald B and Nelson Robert D
Home Financials for this Owner
Home Financials are based on the most recent Mortgage that was taken out on this home.
Original Mortgage
$96,000
Interest Rate
3.6%
Mortgage Type
New Conventional
Purchase Details
Closed on
Mar 31, 2010
Sold by
Seckinger Dorothy Marian
Bought by
Durrence Jo An Seckinger
Purchase Details
Closed on
Oct 31, 1983
Bought by
Seckinger Dorothy Marian
Create a Home Valuation Report for This Property
The Home Valuation Report is an in-depth analysis detailing your home's value as well as a comparison with similar homes in the area
Home Values in the Area
Average Home Value in this Area
Purchase History
| Date | Buyer | Sale Price | Title Company |
|---|---|---|---|
| Forkner Sue Duke | $120,000 | -- | |
| Nelson Donald B | $80,000 | -- | |
| Durrence Jo An Seckinger | -- | -- | |
| Seckinger Dorothy Marian | -- | -- |
Source: Public Records
Mortgage History
| Date | Status | Borrower | Loan Amount |
|---|---|---|---|
| Closed | Forkner Sue Duke | $96,000 |
Source: Public Records
Tax History
| Year | Tax Paid | Tax Assessment Tax Assessment Total Assessment is a certain percentage of the fair market value that is determined by local assessors to be the total taxable value of land and additions on the property. | Land | Improvement |
|---|---|---|---|---|
| 2025 | $1,698 | $78,196 | $15,312 | $62,884 |
| 2024 | $1,698 | $68,190 | $15,312 | $52,878 |
| 2023 | $835 | $59,172 | $12,760 | $46,412 |
| 2022 | $1,936 | $53,000 | $10,440 | $42,560 |
| 2021 | $1,785 | $50,601 | $9,280 | $41,321 |
| 2020 | $1,148 | $31,349 | $9,280 | $22,069 |
| 2019 | $1,043 | $28,807 | $8,640 | $20,167 |
| 2018 | $991 | $27,222 | $8,640 | $18,582 |
| 2017 | $964 | $26,347 | $8,640 | $17,707 |
| 2016 | $992 | $27,871 | $10,080 | $17,791 |
| 2015 | -- | $28,300 | $10,560 | $17,740 |
| 2014 | -- | $32,940 | $15,200 | $17,740 |
| 2013 | -- | $35,340 | $17,600 | $17,740 |
Source: Public Records
Map
Nearby Homes
- 0 Georgia 119 Unit 317227
- 900 Laurel N
- 0 W Madison St
- 179 Hawk Hammock Dr
- 301 S Ash St
- 308 E 4th St
- 404 S Maple St
- 107 Mary St
- 1374 Ga Highway 119 N
- 0 Springfield Egypt Rd Unit SA343058
- 0 Zettler Rd
- 313 Hickory St
- 0 Old Tusculum Rd Unit 10578489
- 0 Old Tusculum Rd Unit SA335776
- 3C Mccall Rd
- 0 Hwy 21 N Unit 329376
- 0 Highway 21 N Unit SA349590
- 0 Georgia 21 Unit C
- 0 Georgia 21 Unit B
- 0 Hwy 21 N Unit SA342214
Your Personal Tour Guide
Ask me questions while you tour the home.