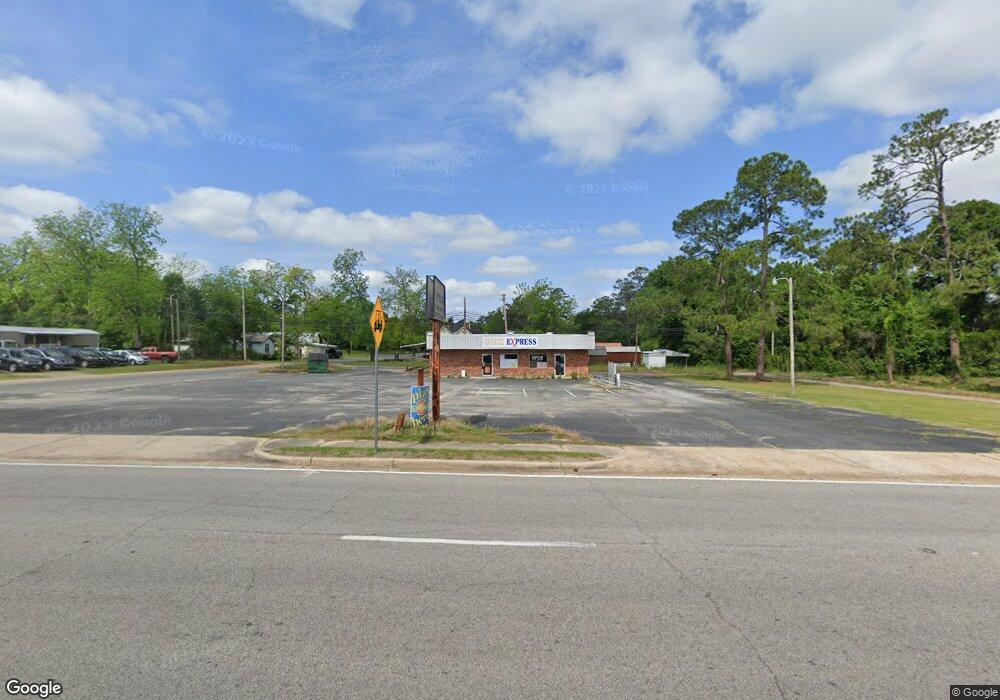
602 N Grant St Fitzgerald, GA 31750
Estimated Value: $473,267
--
Bed
1
Bath
1,886
Sq Ft
$251/Sq Ft
Est. Value
About This Home
This home is located at 602 N Grant St, Fitzgerald, GA 31750 and is currently estimated at $473,267, approximately $250 per square foot. 602 N Grant St is a home located in Ben Hill County with nearby schools including Ben Hill County Primary School, Ben Hill Elementary School, and Ben Hill County Middle School.
Ownership History
Date
Name
Owned For
Owner Type
Purchase Details
Closed on
Apr 30, 2024
Sold by
Riverside Developers Inc
Bought by
Ak 5 Star Family Llc
Current Estimated Value
Purchase Details
Closed on
Oct 20, 2023
Sold by
Cheema Zahida Perveen
Bought by
Riverside Developers Inc
Home Financials for this Owner
Home Financials are based on the most recent Mortgage that was taken out on this home.
Original Mortgage
$305,000
Interest Rate
7.19%
Mortgage Type
New Conventional
Purchase Details
Closed on
Dec 13, 2019
Sold by
Carter Tidwell
Bought by
Cheema Zahida Perveen
Home Financials for this Owner
Home Financials are based on the most recent Mortgage that was taken out on this home.
Original Mortgage
$25,000
Interest Rate
3.7%
Mortgage Type
Commercial
Purchase Details
Closed on
Feb 9, 1978
Sold by
Andrews E L
Bought by
Carter Tidwell
Purchase Details
Closed on
Aug 7, 1972
Bought by
Andrews E L
Create a Home Valuation Report for This Property
The Home Valuation Report is an in-depth analysis detailing your home's value as well as a comparison with similar homes in the area
Home Values in the Area
Average Home Value in this Area
Purchase History
| Date | Buyer | Sale Price | Title Company |
|---|---|---|---|
| Ak 5 Star Family Llc | -- | -- | |
| Riverside Developers Inc | $455,000 | -- | |
| Cheema Zahida Perveen | $39,000 | -- | |
| Carter Tidwell | $35,000 | -- | |
| Andrews E L | $27,100 | -- |
Source: Public Records
Mortgage History
| Date | Status | Borrower | Loan Amount |
|---|---|---|---|
| Previous Owner | Riverside Developers Inc | $305,000 | |
| Previous Owner | Cheema Zahida Perveen | $25,000 |
Source: Public Records
Tax History Compared to Growth
Tax History
| Year | Tax Paid | Tax Assessment Tax Assessment Total Assessment is a certain percentage of the fair market value that is determined by local assessors to be the total taxable value of land and additions on the property. | Land | Improvement |
|---|---|---|---|---|
| 2024 | $2,299 | $53,897 | $10,260 | $43,637 |
| 2023 | $1,507 | $49,134 | $8,208 | $40,926 |
| 2022 | $1,625 | $49,134 | $8,208 | $40,926 |
| 2021 | $1,688 | $49,134 | $8,208 | $40,926 |
| 2020 | $528 | $15,177 | $8,208 | $6,969 |
| 2019 | $629 | $18,160 | $8,208 | $9,952 |
| 2018 | $783 | $18,160 | $8,208 | $9,952 |
| 2017 | $632 | $18,289 | $8,208 | $10,081 |
| 2016 | -- | $18,289 | $8,208 | $10,081 |
| 2015 | -- | $18,289 | $8,208 | $10,081 |
| 2014 | -- | $13,116 | $12,312 | $804 |
Source: Public Records
Map
Nearby Homes
- 503 N Main St
- 616 N Main St
- 209 E Ohoopee St
- 303 W Altamaha St
- 107 Lobingier Ave
- 0 Union Cemetery Rd Unit 20524152
- 106 Van Deman Dr
- 606 W Suwanee St
- 608 W Sultana Dr
- 115 Easy St
- 319 W Magnolia St
- 309 S Lee St
- 0 E Magnolia St
- 613 W Central Ave
- 118 Flint St
- 409 W Magnolia St
- 325 S Lee St
- 225 SW Jessamine
- 807 W Oconee St
- 615 W Pine St