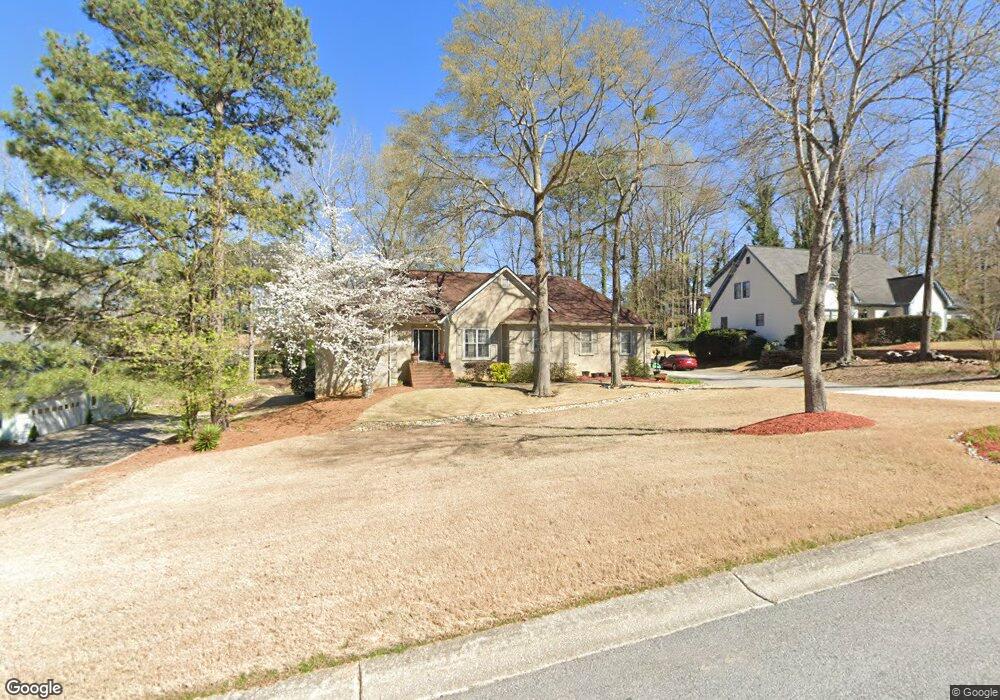
602 Plantation Dr Lithia Springs, GA 30122
Lithia Springs NeighborhoodEstimated Value: $344,000 - $406,000
3
Beds
2
Baths
2,248
Sq Ft
$162/Sq Ft
Est. Value
About This Home
This home is located at 602 Plantation Dr, Lithia Springs, GA 30122 and is currently estimated at $363,895, approximately $161 per square foot. 602 Plantation Dr is a home located in Douglas County with nearby schools including Annette Winn Elementary School, Turner Middle School, and Lithia Springs Comprehensive High School.
Ownership History
Date
Name
Owned For
Owner Type
Purchase Details
Closed on
Jul 31, 2000
Sold by
Hendon Larry C
Bought by
Whitlow Charlene
Current Estimated Value
Home Financials for this Owner
Home Financials are based on the most recent Mortgage that was taken out on this home.
Original Mortgage
$169,950
Outstanding Balance
$61,143
Interest Rate
8.11%
Mortgage Type
FHA
Estimated Equity
$302,752
Purchase Details
Closed on
Jun 30, 2000
Sold by
Streetman Debbie L
Bought by
Hendon Larry C
Home Financials for this Owner
Home Financials are based on the most recent Mortgage that was taken out on this home.
Original Mortgage
$169,950
Outstanding Balance
$61,143
Interest Rate
8.11%
Mortgage Type
FHA
Estimated Equity
$302,752
Purchase Details
Closed on
Dec 1, 1999
Sold by
Hendon Larry C
Bought by
Streetman Debbie L
Create a Home Valuation Report for This Property
The Home Valuation Report is an in-depth analysis detailing your home's value as well as a comparison with similar homes in the area
Home Values in the Area
Average Home Value in this Area
Purchase History
| Date | Buyer | Sale Price | Title Company |
|---|---|---|---|
| Whitlow Charlene | $179,000 | -- | |
| Hendon Larry C | -- | -- | |
| Streetman Debbie L | -- | -- |
Source: Public Records
Mortgage History
| Date | Status | Borrower | Loan Amount |
|---|---|---|---|
| Open | Whitlow Charlene | $169,950 |
Source: Public Records
Tax History Compared to Growth
Tax History
| Year | Tax Paid | Tax Assessment Tax Assessment Total Assessment is a certain percentage of the fair market value that is determined by local assessors to be the total taxable value of land and additions on the property. | Land | Improvement |
|---|---|---|---|---|
| 2024 | $3,359 | $131,400 | $26,000 | $105,400 |
| 2023 | $3,359 | $102,920 | $12,200 | $90,720 |
| 2022 | $2,900 | $102,920 | $12,200 | $90,720 |
| 2021 | $2,598 | $87,640 | $12,200 | $75,440 |
| 2020 | $2,638 | $87,640 | $12,200 | $75,440 |
| 2019 | $2,698 | $97,280 | $14,000 | $83,280 |
| 2018 | $2,662 | $94,880 | $14,000 | $80,880 |
| 2017 | $2,483 | $84,360 | $14,000 | $70,360 |
| 2016 | $2,020 | $64,200 | $10,960 | $53,240 |
| 2015 | $2,159 | $67,160 | $11,800 | $55,360 |
| 2014 | $1,959 | $60,000 | $11,440 | $48,560 |
| 2013 | -- | $63,680 | $12,200 | $51,480 |
Source: Public Records
Map
Nearby Homes
- 480 Paces Dr
- 475 Paces Dr
- 3347 Skyview Dr
- Heron Cottage Plan at Paces Estates
- Brookpark Plan at Paces Estates
- Inwood Plan at Paces Estates
- Lakewood Plan at Paces Estates
- 485 Paces Dr
- 2081 Orchid Ln
- 545 Paces Dr
- 3340 Skyview Dr
- 515 Paces Dr
- 2102 Orchid Ln
- 2180 Highridge Point Dr
- 3476 Cooper St
- 6069 Wisteria Ln
- 2230 Highridge Point Dr
- 0 Lakeside Dr Unit 7667066
- 325 Paces Dr
- 6660 Maxwell Dr
- 612 Plantation Dr Unit 3
- 592 Plantation Dr Unit 3
- 6819 Heritage Pkwy
- 6833 Heritage Pkwy
- 622 Plantation Dr
- 0 Plantation Dr Unit 7190234
- 6807 Heritage Pkwy Unit 2/13
- 6807 Heritage Pkwy
- 605 Plantation Dr
- 582 Plantation Dr
- 595 Plantation Dr Unit 3
- 615 Plantation Dr Unit 3
- 6847 Heritage Pkwy
- 6795 Heritage Pkwy
- 585 Plantation Dr
- 632 Plantation Dr
- 625 Plantation Dr
- 572 Plantation Dr Unit 3
- 575 Plantation Dr Unit 3
- 6865 Heritage Pkwy Unit 2