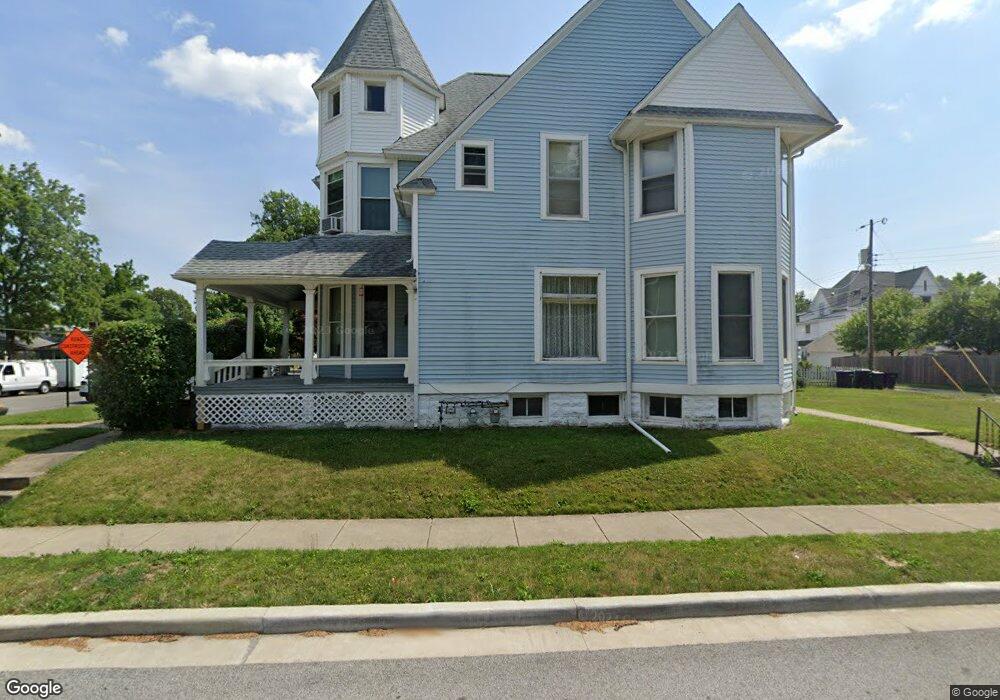
602 S 11th St Lafayette, IN 47905
Valley Center NeighborhoodEstimated Value: $263,000 - $366,000
--
Bed
3
Baths
2,532
Sq Ft
$125/Sq Ft
Est. Value
About This Home
This home is located at 602 S 11th St, Lafayette, IN 47905 and is currently estimated at $317,667, approximately $125 per square foot. 602 S 11th St is a home located in Tippecanoe County with nearby schools including Thomas Miller Elementary School, Lafayette Tecumseh Junior High School, and Sunnyside Intermediate School.
Ownership History
Date
Name
Owned For
Owner Type
Purchase Details
Closed on
Sep 18, 2025
Sold by
Brock Family Trust and Brock David F
Bought by
Tippecanoeco Properties Llc
Current Estimated Value
Home Financials for this Owner
Home Financials are based on the most recent Mortgage that was taken out on this home.
Original Mortgage
$150,000
Outstanding Balance
$150,000
Interest Rate
5.75%
Mortgage Type
New Conventional
Estimated Equity
$167,667
Purchase Details
Closed on
Feb 25, 2015
Sold by
Brock David F and Brock Beverly R
Bought by
Brock Trust
Purchase Details
Closed on
Oct 30, 2002
Sold by
Sawmiller Donna J
Bought by
Brock David F and Brock Beverly R
Home Financials for this Owner
Home Financials are based on the most recent Mortgage that was taken out on this home.
Original Mortgage
$89,625
Interest Rate
6.18%
Mortgage Type
Commercial
Create a Home Valuation Report for This Property
The Home Valuation Report is an in-depth analysis detailing your home's value as well as a comparison with similar homes in the area
Home Values in the Area
Average Home Value in this Area
Purchase History
| Date | Buyer | Sale Price | Title Company |
|---|---|---|---|
| Tippecanoeco Properties Llc | -- | None Listed On Document | |
| Brock Trust | -- | -- | |
| Brock David F | -- | -- |
Source: Public Records
Mortgage History
| Date | Status | Borrower | Loan Amount |
|---|---|---|---|
| Open | Tippecanoeco Properties Llc | $150,000 | |
| Previous Owner | Brock David F | $89,625 |
Source: Public Records
Tax History Compared to Growth
Tax History
| Year | Tax Paid | Tax Assessment Tax Assessment Total Assessment is a certain percentage of the fair market value that is determined by local assessors to be the total taxable value of land and additions on the property. | Land | Improvement |
|---|---|---|---|---|
| 2024 | $2,932 | $146,600 | $30,000 | $116,600 |
| 2023 | $2,202 | $110,100 | $30,000 | $80,100 |
| 2022 | $2,138 | $106,900 | $30,000 | $76,900 |
| 2021 | $2,096 | $104,800 | $30,000 | $74,800 |
| 2020 | $2,096 | $104,800 | $30,000 | $74,800 |
| 2019 | $2,096 | $104,800 | $25,000 | $79,800 |
| 2018 | $2,034 | $101,700 | $25,000 | $76,700 |
| 2017 | $1,980 | $99,000 | $25,000 | $74,000 |
| 2016 | $1,960 | $97,990 | $25,000 | $72,990 |
| 2014 | $1,864 | $93,200 | $25,000 | $68,200 |
| 2013 | $1,760 | $88,000 | $25,000 | $63,000 |
Source: Public Records
Map
Nearby Homes